Visualization
Showing the stories in data through statistics, design, aesthetics, and code.
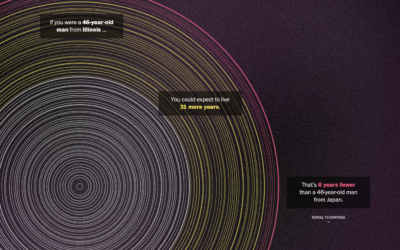
Tree rings to compare life expectancy in your state
The Washington Post goes with a tree ring metaphor to compare life expectancy…
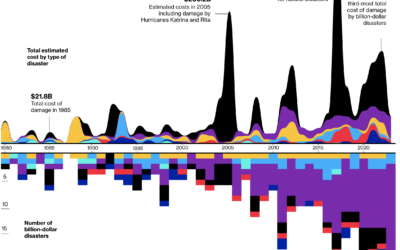
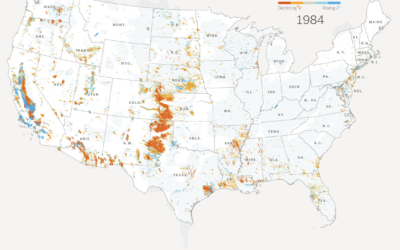
Billion dollar natural disasters
For Bloomberg, Rachael Dottle and Leslie Kaufman go with the combo stacked area…
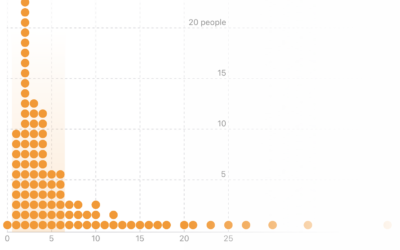
Visual explanation of menstrual cycle length and variability
For the Apple Women’s Health Study, which uses cycle tracking data from iPhones…

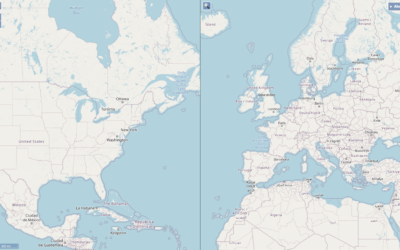
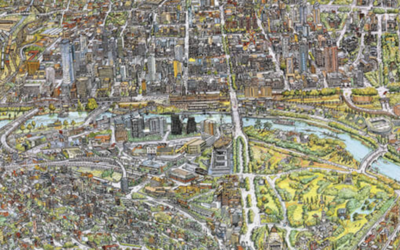
Search the text in historical maps
The David Rumsey Map Collection has been home to tens of thousands of…
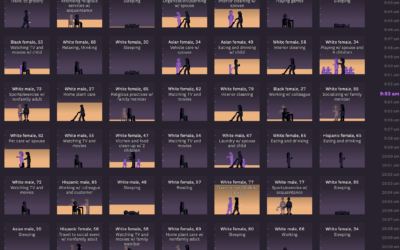
Loneliness, life satisfaction, and time
For The Pudding, Alvin Chang examines loneliness through the lens of individual responses…
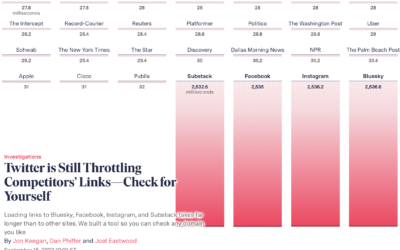
Twitter slows competitor links
When you click a link on Twitter, you go through a Twitter shortlink…
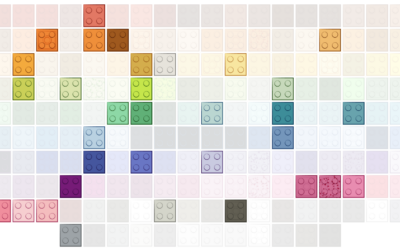
Evolution of Lego brick colors
Lego started with five brick colors: red, yellow, blue, white, and clear. The…
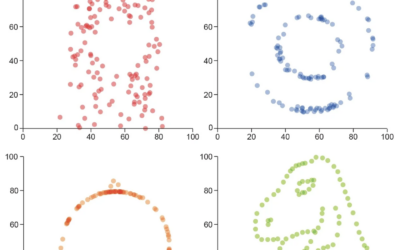
Visualization to better see true values in data
For Scientific American, Jack Murtagh describes the importance of visualization in understanding the…
Very Expensive Maps
In the Very Expensive Maps podcast, cartographer Evan Applegate interviews other cartographers about…
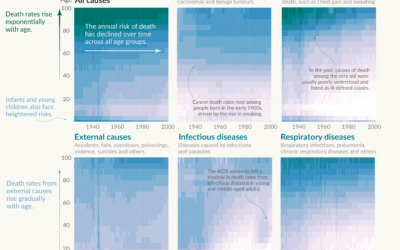
Shifting causes of death over the decades
Saloni Dattani, for Our World in Data, used a set of heatmaps to…
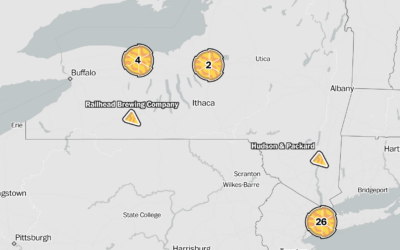
Looking for the best pizza for different styles in different places
Locating the best pizza depends on where you are and what kind of…

Clock plays a song with the current time in its title
For The Pudding, Russell Samora pulled songs via the Spotify API and made…
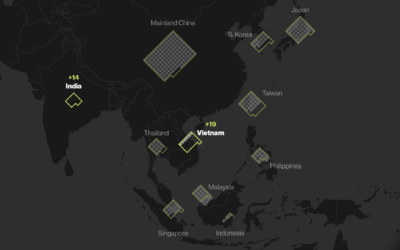
Apple’s global suppliers
Most of Apple’s suppliers and manufacturing happen outside the United States and in…

Infinity abstractions
Infinity is an abstraction of endlessness, which seems to suggest that it cannot…