Visualization
Showing the stories in data through statistics, design, aesthetics, and code.

Visually navigate code as stars and galaxies
Andrei Kashcha visualized major software packages as galaxies that you can fly through.…

Seeing the world after Google Streetview
Trevor Rainbolt is really good at geolocating a place given a single frame…

Shrinking down to the size of an atom
{"@context":"http:\/\/schema.org\/","@id":"https:\/\/flowingdata.com\/2024\/07\/02\/shrinking-down-to-the-size-of-an-atom\/#arve-youtube-rn9dkv4svyq","type":"VideoObject","embedURL":"https:\/\/www.youtube.com\/embed\/rn9dkV4sVYQ?feature=oembed&iv_load_policy=3&modestbranding=1&rel=0&autohide=1&playsinline=0&autoplay=0"}
In a different take on showing the scale of very tiny things,…
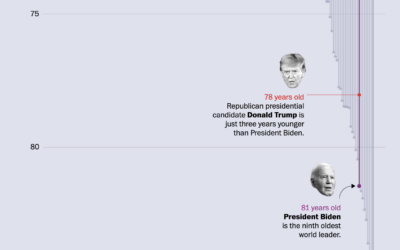
Age differences between world leaders and the populations they serve
The ages of American presidential candidates are old when compared to the ages…
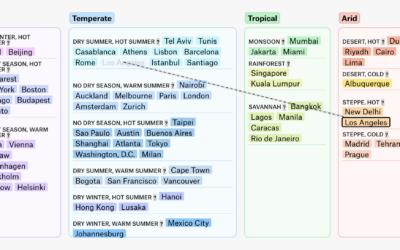
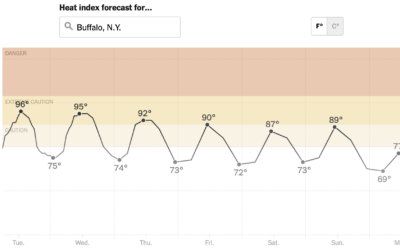
Changing climate zones of major cities
A global map of climate change can make a few degrees of rising…
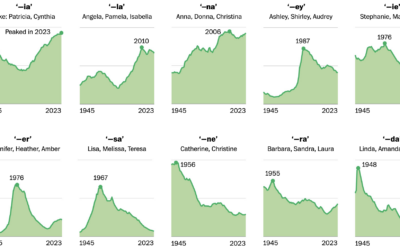
Trendy baby name sounds
For WP’s Department of Data, Daniel Wolfe analyzed baby name data with Laura…
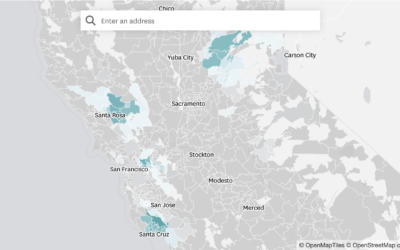
Where State Farm Insurance is dropping home policies
State Farm won’t be renewing about 30,000 policies because of high wildfire and…
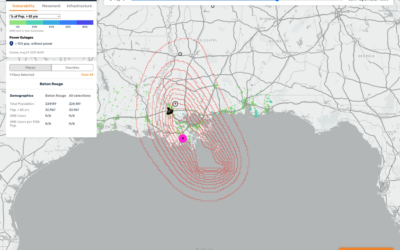
Mapping hurricane winds with avocado of uncertainty
Stamen, whose design breakdowns I always appreciate, discusses why they took a different…

Visualizing GitHub commit history in a 3-D virtual space
Ren Yuan visualized the GitHub commit history for the PyTorch library. The virtual…
Hockey player tracking projected on ice for live watch party
During the Dallas Stars away games during this year’s NHL playoffs, fans could…
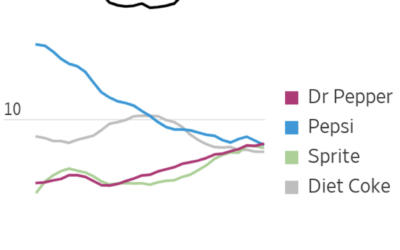
Dr Pepper ties with Pepsi-Cola for number two soda
Dr Pepper steadily rose and Pepsi steadily declined over the past couple of…


Currently, a light display that shows where your energy is from
Currently is a prototype ambient display that shows where your energy comes from.…
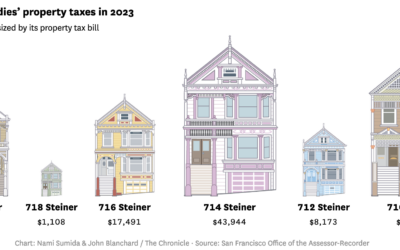
California property taxes, through the Painted Ladies houses
The Painted Ladies houses, which includes the house from the 1990s sitcom Full…
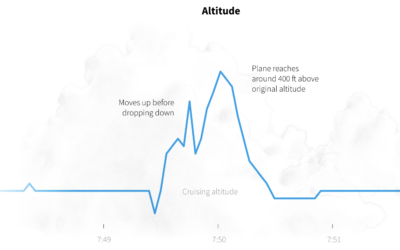
Flight turbulence on the Singapore Airlines flight, visually explained
Last week, a Singapore Airlines flight experienced turbulence that led to one person…
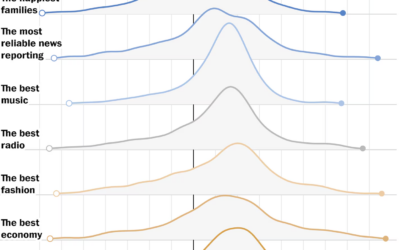
When feelings of nostalgia peak
YouGov surveyed 2,000 adults asking them when was the best and worst decades…
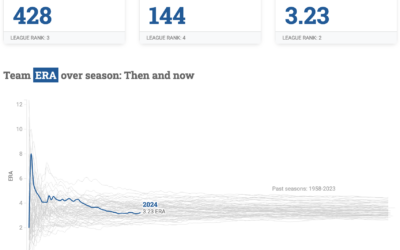
Dashboard for L.A. Dodgers baseball
To keep track of performance, Matt Stiles made the Dodgers Data Bot, which…