Visualization
Showing the stories in data through statistics, design, aesthetics, and code.
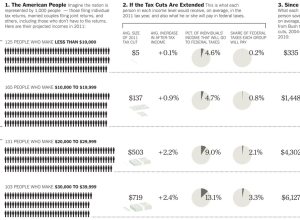
Who gets what if tax cuts are extended
There are some major tax decisions to be made soon, and they’ll affect…

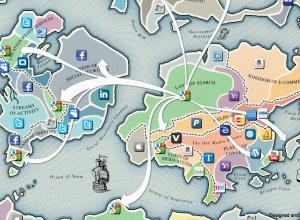
Augmented reality atlas
The mockup examples are more cool factor than useful in this augmented reality…
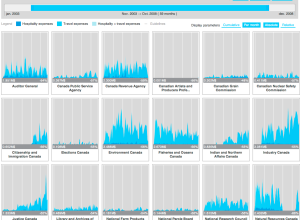
Expense visualizer
In an effort to make Canadian government expense data more accessible, FFunction designed…
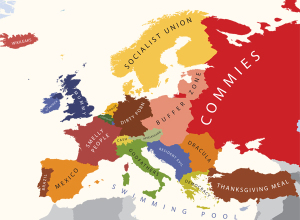
Europe geographically stereotyped
We tend to see the world in different ways, depending on what part…
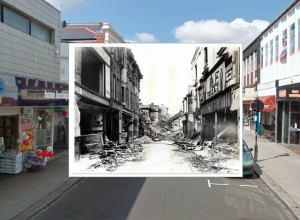
History of the Blitz bombings
In September 1940, Nazi Germany began bombing London for 76 consecutive nights in…
Tune in live to Data Visualization and Infographics meetup
The NY Data Visualization and Infographics meetup is about to start, and you…
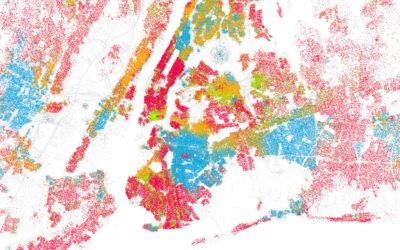
Race and ethnicity mapped by block
Instead of breaking up demographics by defined boundaries, Bill Rankin uses dots to…

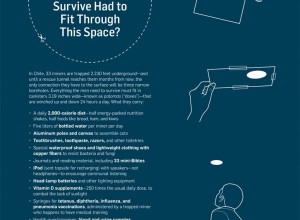
Electronic Medical Records by the numbers
In 2009, legislation mandated that doctors make use of electronic medical records by…

History of the Iraq War through Wikipedia edits
Through high school and sometimes beyond we’re taught history as absolute fact. It’s…
The state of mapping APIs
O’Reilly Radar surveys the state of mapping APIs from old sources (like Google)…
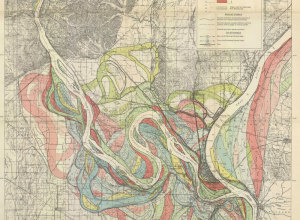
Evolving path of the Mississippi River
We often think of rivers as following a given path for the course…
Where your neighbors commute to and from
Some people live in areas where a one-hour commute both ways is common,…
Illustration of ideas and concepts
In a different take on the infographic, RSA Animate illustrates the ideas and…

The future of self-service banking
Too many slots. Too many buttons. Spanish bank BBVA and design consultancy IDEO…
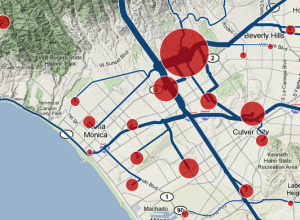
Social life of Foursquare users mapped
Foursquare, the location-based social network, lets people share their location with others in…
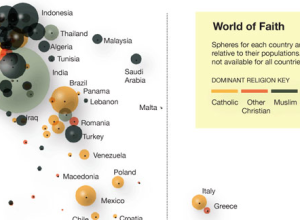
Faith and poverty in the world
Using data from a recent Gallup report showing a correlation between wealth and…