Visualization
Showing the stories in data through statistics, design, aesthetics, and code.

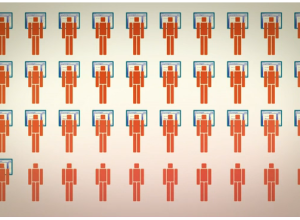
Animated graphic on why you should shut off your work computer
Millions of people leave their work computer on every day, thus wasting lots…

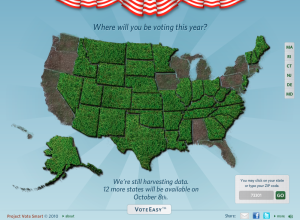
Conversation with Obama: track and ask questions on Twitter
President Obama will be answering questions live at a youth town hall today…
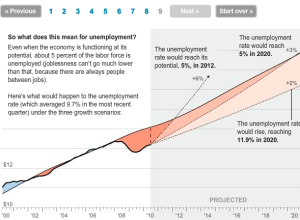
Explanation of current economic slump
Neil Irwin and Alicia Parlapiano of The Washington Post report with this interactive…
How K-12 schools in your area measure up
In collaboration with NBC News and The Gates Foundation, Ben Fry-headed Fathom Design…
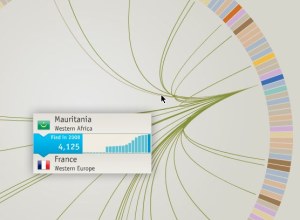
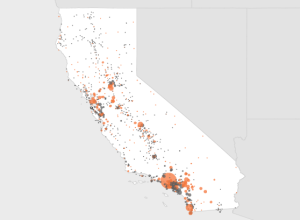
Where refugees come from
Thousands of people flee their country every year, and the travel patterns are…
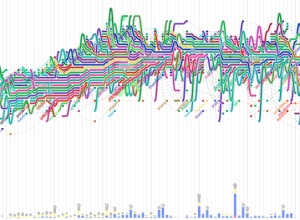
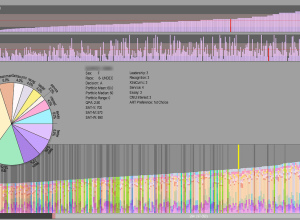
Software evolution storylines
In a follow up to code_swarm, a visualization to show the development of…
Map series of oil spill in Gulf
Everyone’s fascinated with animated graphics, which is cool, but sometimes a series of…
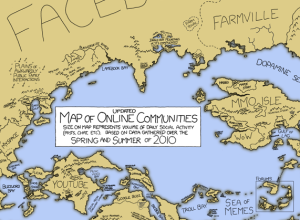
Fictional map of online communities
xkcd + numbers on online communities. Need I say more? Along the same…
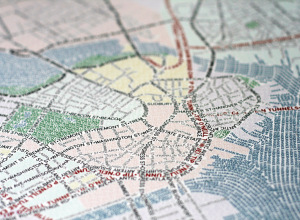
Typographic maps
Cartography group Axis Maps continues their run of mapping goodness with the announcement…
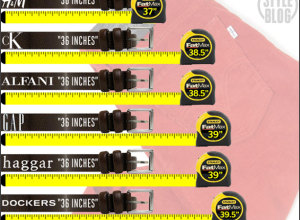
Challenge: Advertised vs. actual waistline
Ever notice how pants seem to fit differently from store-to-store even though they’re…
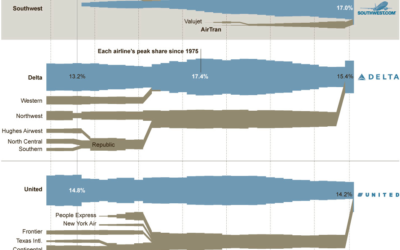
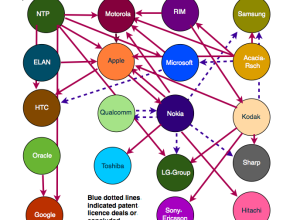
Charted history of airline mergers
Airlines have been merging, going out of business, and growing since forever. Karl…
Exploratory tool for school admissions
With thousands of applications, it can be tough deciding who to admit in…
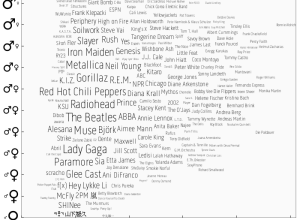
Music listening preferences by gender
Last.fm intern Joachim Van Herwegen has a quick look at listening habits by…
Journalism in the Age of Data
In the words of Terrell Owens, get your popcorn ready, because this video…