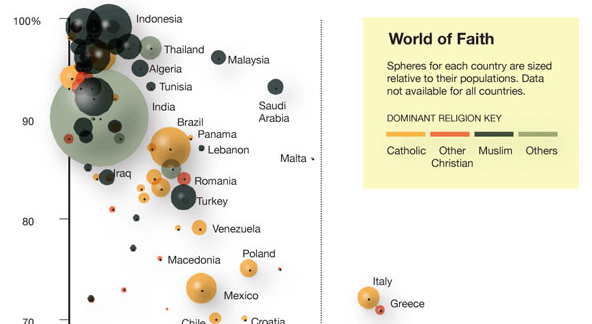
Using data from a recent Gallup report showing a correlation between wealth and faith, Charles M. Blow reports in graphic form. Each sphere, sized by population, represents a country. Spheres are colored by dominant religion in that country.
The United States is an outlier among the relatively richer countries. While the United States is the richest country by GDP per capita, 67% of Americans say that religion is important in their daily lives. Compare that to France, Britain, and Japan who report 30% or less.
On the flip side of that, it looks like there’s a cluster of countries with both low GDP and low religiosity, such as Vietnam and Russia.
Many scientists believe “religion plays a more functional role in the world’s poorest countries, helping many residents cope with a daily struggle to provide for themselves and their families.”
Does this suggest that outliers might use other ways to cope with struggle?
[via]
 Visualize This: The FlowingData Guide to Design, Visualization, and Statistics (2nd Edition)
The dominant religion in Russia is Eastern Orthodox Christianity, not “Other”. Just sayin’.
Very interesting correlation.
I wonder if the dominant religion in Russia is still officially “atheism”, a holdover from the Soviet Communist era? Similarly in Vietnam.
“others”? Just Others? Seriously?
comparing christianity and islam over and over…ehhhhh
I don’t really see the need for the (poor) categorization of countries wrt “dominant religion.” Many countries are very diverse, and two of the categories given use the word “other” which seems silly to me. Except for the cluster of poor/religious countries, in the top right, I don’t see a trend here. If I was given this graph without the labels and the hypothesis, I would say that this graph simply reflects that (a) most of the world is poor and (b) most of the world is religious. Given both of those facts, of course there will be a cluster in the top left.
Another reason that I think that the “dominant religion” piece seems useless… it seems to me that those countries which are most fervant (Romania, Lebanon, U.S.) have rather diverse and vocal minority religions. In the case of Lebanon, this religious tension has obviously contributed to a relatively low GDP. I’d be more interested in seeing how religious diversity is correlated with religiousity and wealth.
A response to this chart I found via twitter (@politicalmath). http://www.politicalmathblog.com/?p=605
An interesting hypothesis here on American exceptionalism:
http://www.rovingbandit.com/2010/05/why-is-america-so-much-more-religious.html
Which the cause, and which the effect?
*cough* confounding *cough*
This is…this…this is almost comical.
Wealth and poverty are functions of so many other things. Considering the world as a whole, natural resources and geography are major causal factors. Religion is local. Irony withstanding, Gallup has defined religion geopolitically like say… natural resources and geography is. SUPRISE!
If “religion plays a more functional role in the world’s poorest countries, helping many residents cope with a daily struggle to provide for themselves and their families.” (sic), then I’d like to know whether that is binary or categorical. In other words, religion may help, but does it really matter what kind of religion.
National resources and geography? Environmental determinism is no more helpful to understand global development levels than religiosity.
“Environmental determinism” is about as quackery as the weather being determined by the latitudes. It suggests that climates effect psychology like lazy people near the equator. Rather geography and natural resources are, in my opinion, prime drivers of the economics. I’ll call it geographic economics for lack of a better name.
If by “global development levels”, you mean wealth. I’d say,yes, things like flat land, access to ports, natural resources, favorable weather patterns are strong indicators of long-term success – something of a combination of Paul Krugman’s seminal work and Jared Diamond.
I think the original graph intends to show an inverse relationship where the more a country makes per person the less religious it is. I’d love to see a Hans Rosling done on this kind of data to see if as GDP per capita went up, the religiousity went a certain way. I’d put my money where my mouth to say that it would not be definitive let alone suggestive.
@ Darin (i can’t seem to reply directly to your post, so hope this works)
If by ‘geography and natural resources’ you mean ‘physical geography and natural resources’ are determinants of development you’re on a ill-informed and dangerous road. Google ‘resource curse’ for starters.
“things like flat land, access to ports, natural resources, favorable weather patterns are strong indicators of long-term success”
If you’re laying Civilization, maybe. But in the real world political power (and favour), and the ability to resist exploitation of markets, labour and resources by foreign bodies (e.g. TNCs) are far more important factors when examining a country’s development trajectory. Countries like too many in Africa aren’t underdeveloped because they don’t have flat land, access to ports, natural resources, and favorable weather patterns. They are underdeveloped because of exploitation, and geo-political power asymmetries which do not allow them to develop. This is the 21st century, people determine development, not access to land and weather ffs.
But what software did he use to produce the chart?
Please stop repeating the myth. USA is not the richest country, measured by GDP/capita, not even close.
Infact it’s the 9th richest country, if you look at nominal dollar-values, and the 6th richest if you look at purchasing-power.
Nice analysis really. I’m really impressed with this.
@Matthew Hanlon:
That was just plain painful. I guess this proves beyond any doubt that the NYT is no longer a publication that takes itself seriously. Such errors have to be deliberate manipulation. Thanks for the link.
The NYT has been one of the main source of western propaganda for a long time. Unfortunately this is just one example out of many. If you don’t know already, “Manufacturing Consent’ is a very interesting documentary about this topic: http://video.google.com/videoplay?docid=-5631882395226827730#
where’s china?
I like the giant grey “other” bubble for India. Reminds me of the Simpsons episode where Apu said “Miscellaneous? I’m Hindu! There are 980 million of us, you know!”
It would be fun to viz this dataset in Gapminder so that we could track it over time and look out for other confounding factors. Like how big the next-most-dominant religion is.
It would be interesting to see this chart with the GDP weighted per capita.
Has no one noticed that Mr. Blow didn’t chart Singapore, which is both more religious and richer than the US?
@Matthias,
Follow the link that Matthew Hanlon posted (#6)
@Justin,
Didn’t see it. I’m an idiot.
Failing to follow every link in the comments to a blog post makes you efficient, not an idiot.
Pingback: More Poverty = More Religion | The Big Picture
Where the hell is China?
I agree that the visualization as it is right now is somewhat misleading. Following on Nathan’s lead, I think that adding dimensions to the data (political system, anyone? Communism, past or present, seems to correlate with low religiosity together with poverty, possibly accounting for that cluster in the lower left corner of the graph) and using an exploratory data-analysis method, such as clustering, might yield further insight into the co-occurence of religiosity and poverty.
I recreated this interesting infographic in Excel and made it interactive. It’s on my blog.
I agree with the criticism against this inforgraphic, however I think it is some interesting poli-sci observations can eb drawn from catergorizing countries by quadrants:
While I agree with your general points, I think you misunderstood the point of the article. First of all, correlation obviously does not imply causation. The point of the article is that the US was an anomoly when compared to many other wealthy countries. Your use of the Taiwan and Singapore is a clear refuation of this.
However, I think the chart is still useful as way of visualizing countries along their relationship with religion. The countries can be grouped in 4 catergories:
Lower-left: Former or (Current) Communist Countries poor and mostly atheist
Lower-right: Semi-socialist developed countries (Western European model), generally wealthy, atheist
Upper-left: developing countries, religious and poor
Upper-right: religious and wealthy, some are very free-market oriented like US, Ireland Taiwan and Singapore (if they were included), and some are still semi-socialist (Israel, Italy, Greece)
ignore my middle paragraph, is there an edit feature?
I suspect that if the X axis was depicting “median wage” rather than “GDP per capita”, the USA would not be an outlier at all.