Visualization
Showing the stories in data through statistics, design, aesthetics, and code.
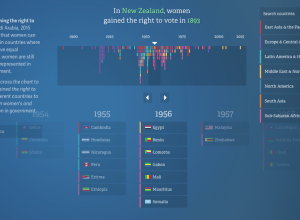
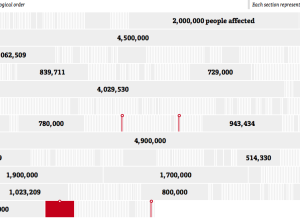
Equality for women and girls, 20-year report
In their continued work on the No Ceilings project, Fathom describes the current…
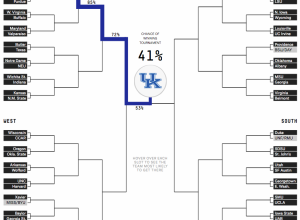
NCAA tournament bracket predictions
March Madness starts this week in the states, which means it’s time for…
Wearable data objects that represent air pollution
For the most part, air pollution is invisible, so Stefanie Posavec and Miriam…
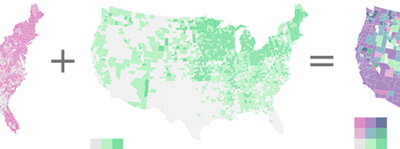
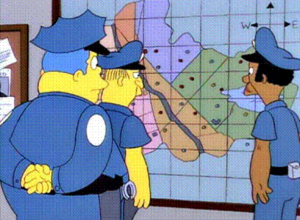
Bivariate choropleth how-to
Your standard choropleth map shows geographic areas colored by a single variable. You’re…
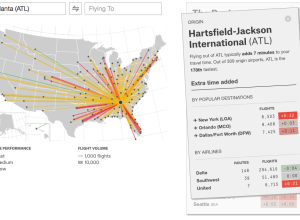
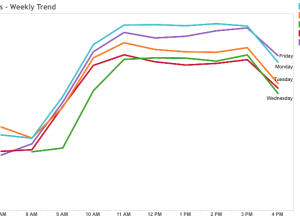
Find the fastest flight between airports
Flight arrival and departure times are often thought of in terms of “on…
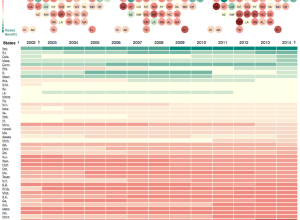
Health data breaches and fines
Sisi Wei and Charles Ornstein for ProPublica highlight reported data breaches to the…
Decline of workers’ compensation
Workers’ Compensation, a promise to pay medical bills and some of your wages…
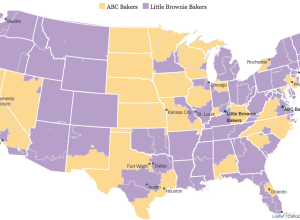
Girl Scout cookies differ by region
The Girl Scouts, known for their annual cookie sales, uses two bakers. These…

On Broadway shows city life through data cross-sections
On Broadway, by Daniel Goddemeyer, Moritz Stefaner, Dominikus Baur, and Lev Manovich, provides…
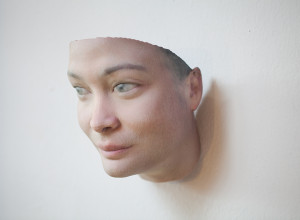
Face sculptures using DNA from chewed gum
In her 2012 piece Stranger Visions, Heather Dewey-Hagborg used DNA found in public…
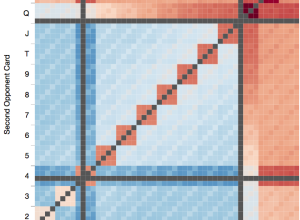
Texas hold ’em win probabilities
Software engineer Chris Beaumont visualized the strength of opponent hands in Texas hold…
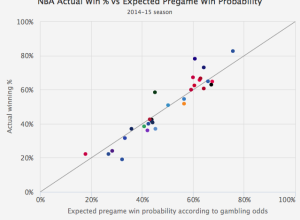
Gambler’s perspective on sports team win probabilities
Michael Beuoy’s win probability model plotted on FiveThirtyEight starts all NBA teams at…
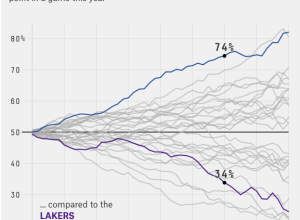
Every NBA team’s chances of winning, by game minute
Michael Beuoy made a win probability model for NBA teams and games, based…
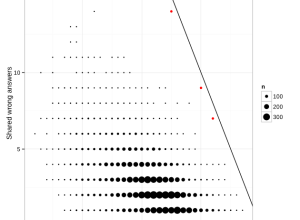
Identifying cheaters in test results, a simple method
Jonathan Dushoff had issues with students in his population biology class cheating on…

Bayes’ theorem explained with LEGO bricks
Bayes’ theorem is covered in introduction to statistics and probability courses, but I…
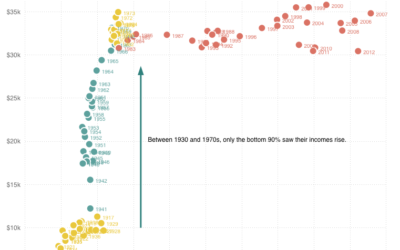
Top 1% earners versus bottom 90%
Quoctrung Bui for Planet Money plotted average income for the top one percent…