Michael Beuoy’s win probability model plotted on FiveThirtyEight starts all NBA teams at a 50% chance of winning. Then the probability of winning a game increases and decreases from there. However, practically speaking, we know something about the teams before each game, and we don’t give even chances to the worst and best team at the zero-minute mark.
So Todd Schneider took a different approach to minute-by-minute win probability — from a gambling perspective. Each line in the time series starts closer to the end probability as gamblers wager based on what they think the final outcome will be.
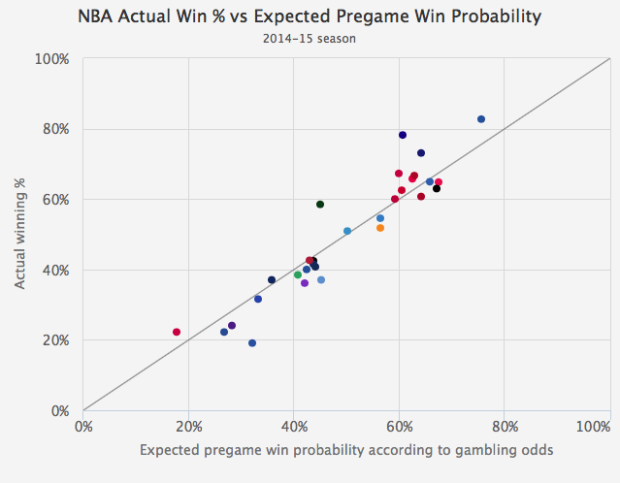
I like the plot that shows gamblers’ expectations against actual win percentage.
The Atlanta Hawks currently lead the league in “wins above gamblers’ expectations”, with an actual winning percentage of 78.2% compared to an expected winning rate of 60.6%. The Milwaukee Bucks and Memphis Grizzlies have also both performed significantly above gamblers’ expectations. The lowly New York Knicks, in addition to having the worst absolute record in the league, are performing the worst relative to gamblers’ expectations. The Knicks have been expected to win 32.2% of their games, and yet have only managed to win 19.1%.
The takeaway: Yes, you expect the Knicks to play poorly, but they go beyond your expectations and play even worse than you imagined.
See the probabilities for professional football and baseball too. [Thanks, Todd]
 Visualize This: The FlowingData Guide to Design, Visualization, and Statistics (2nd Edition)