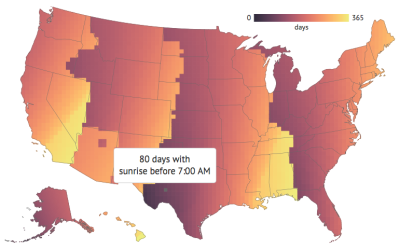
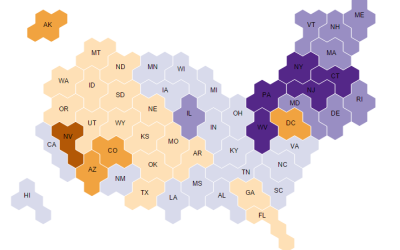
Keith Collins for Quartz made an interactive that showed how much more daylight…
Maps
Intuitive to look at spatial patterns and great for distributing geographic data.
-
Daylight Saving Time geography
-
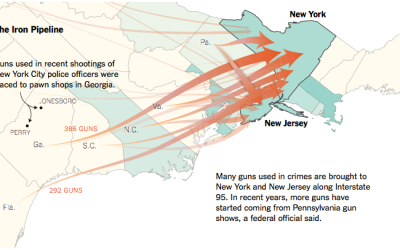
Out-of-state gun purchasing
In states with stricter gun laws, firearms still find their way in. Based…
-
The Sun in ultra-HD
Daang, NASA. Using images of the sun taken in space, NASA constructed this…
-
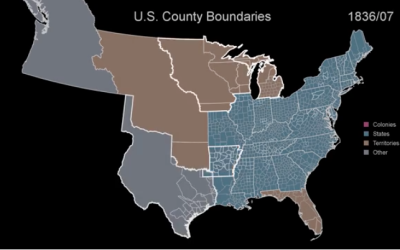
US boundary evolution
We saw a similar video of boundary development over the centuries before, but…
-
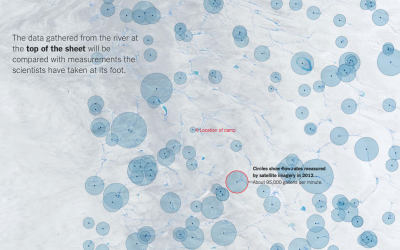
Melting Greenland
This map-centric piece from the New York Times is good. They keep refining…
-
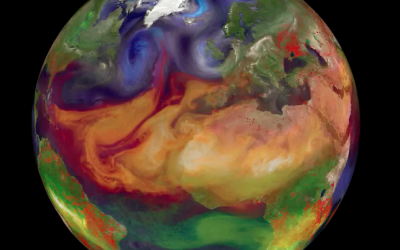
Particles swirling in the atmosphere
Gavin Schmidt shows different types of particles that swirl around in our atmosphere:…
-
London Underground rent map
In a straightforward map, Jason Allen for Thrillist replaced station names on the…
-
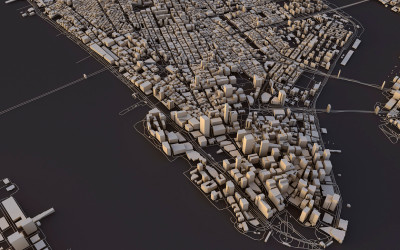
City layouts in 3-D
They look like little cardboard cutouts.
-
Way more trees than previously thought, new estimates show
There are a lot of trees on this planet.
-
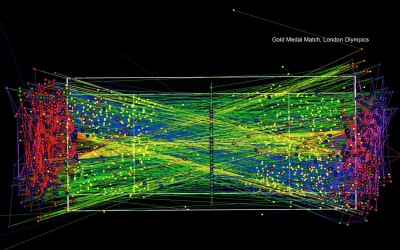
Maps to understand tennis
Damien Saunder, a cartographer at ESRI, likes to use mapping methods to evaluate…
-
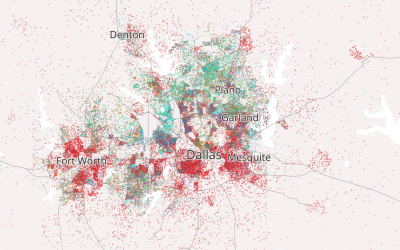
Immigrant America
A dot density map showing one dot for every 20 immigrants.
-
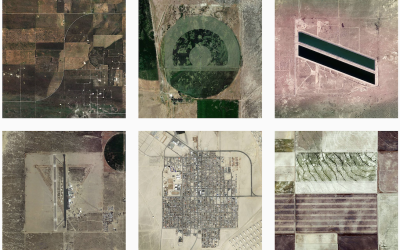
Square mile grid-ness of the United States
Named after the grid system Thomas Jefferson used to apportion land acquired through…
-
Live cyber attack map
Norse monitors cyber attacks in real-time. This is their map of what’s going…
-
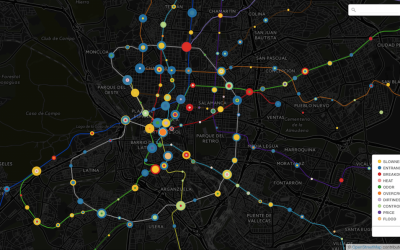
Subway complaints by station
This map of subway complaints in Madrid isn’t geographically relevant to me, but the encoding scheme is interesting.
-
Link
Make grid maps in Python →
A quick script for squares and hexagons that outputs to SVG.
-
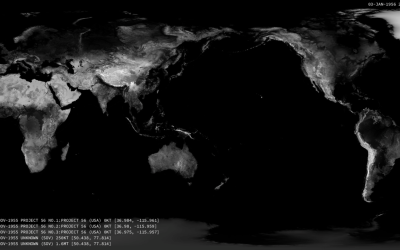
Nuclear detonations from 1945 to present
There have been over 2,000 nuclear detonations since 1945. Orbital Mechanics mapped each…
-
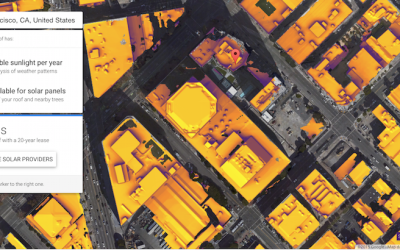
Mapped: Solar energy and savings if you got panels
Punch in your address. See how much you could save, based on a variety of data sources.
-
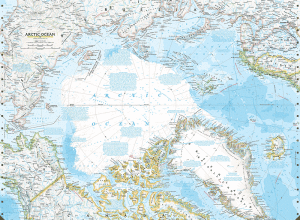
Disappearing Arctic reflected in National Geographic maps
In the most recent update to their atlas coming in September, National Geographic…





 Visualize This: The FlowingData Guide to Design, Visualization, and Statistics (2nd Edition)


