I always know when something exciting happens in the World Cup when my…
Infographics
Telling stories with data and graphics.
-
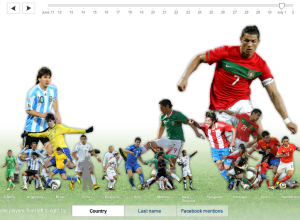
Top World Cup players on Facebook
-
Challenge: What is a FIFA player’s worth?
I really want to like this graphic on the “worth” of FIFA players.…
-
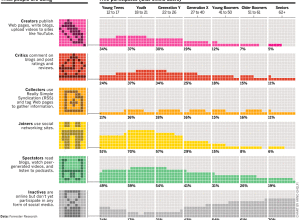
Who participates online, by age
Arno Ghelfi for Businessweek reports on who’s doing what online, separated by age.…
-
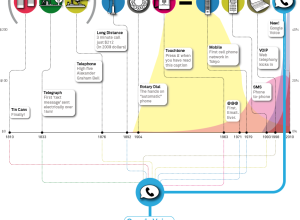
Modern history of human communication
With the announcement of Google Voice for everyone, the big G describes the…
-
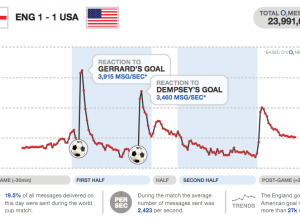
Texting volume during World Cup matches
I love how major sporting events can captivate an entire country or region,…
-
Education crisis explained in motion graphics
Buck, in collaboration with TakePart and An Inconvenient Truth director, Davis Guggenheim, describe…
-
How to beat Mario Brothers 3 in 11 minutes
I think it took me a few months to beat Super Mario Brothers…
-
Free kick mechanics explained
I know next to nothing about soccer (a.k.a. football), but I gotta admit…
-
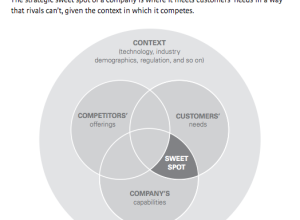
Profitable sweet spot for startups
Gosh, it’s so easy. I’m going to be rich. Get the strategic sweet…
-
Glasses: the ultimate image changer
This is hilarious and uber creative advertising. If I wore glasses, I’d totally…
-
Meet iPad’s competition
Light on the data, heavy on the aesthetics. Super pretty by Section Design.…
-
Facebook cultish insignia
When asked to take off his hoodie during D8, Facebook CEO Mark Zuckerberg…
-
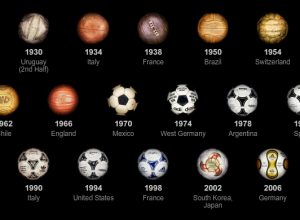
Evolution of the World Cup ball
With the World Cup in full swing, the New York Times has been…
-
Physics of oil spills explained
What exactly is going on with all the oil spewing into the Gulf,…
-
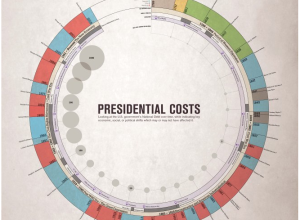
History of the United States in a circle
Presidential Costs by Rachel Mercer offers a look at the history of the…
-
Context to underwater depths
The Deepwater Horizon well is nearly a mile deep in water. It extends…
-
Track the 2010 MTV Movie Awards
Excited about the 2010 MTV Movie Awards? Yeah, me neither. But if you…
-
How little musicians earn online
You’ve heard about the struggling musician. It’s a tough business. How tough is…










 Visualize This: The FlowingData Guide to Design, Visualization, and Statistics (2nd Edition)


