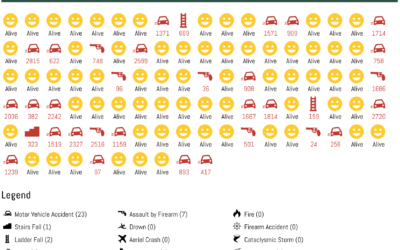
Here’s a fun what-if simulation that imagines a world where all natural causes…
Infographics
Telling stories with data and graphics.
-
Life expectancy if all diseases were magically cured
-
Senators and Reps whose voting doesn’t quite match the constituent’s
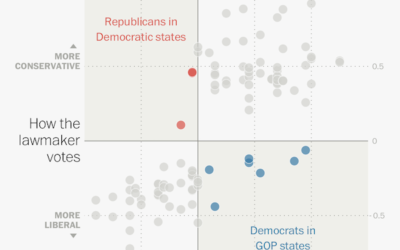
I know, it’s only April 2017, but some senators and representatives have some…
-
Finding the craft beer capital of America
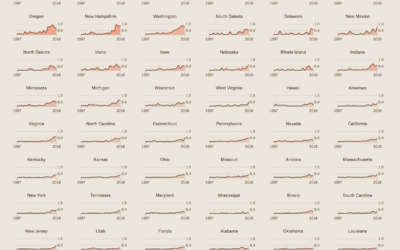
You had me at craft beer. Russell Goldenberg for The Pudding looks for…
-
Climate Change Coloring Book
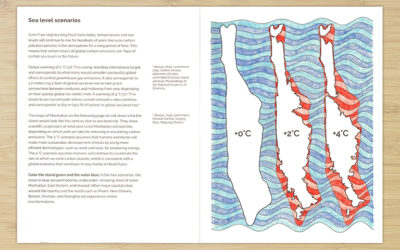
The Climate Change Coloring Book by Brian Foo makes data tactile and interactive.…
-
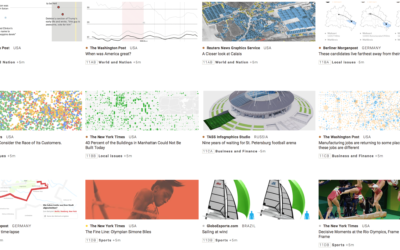
Best infographics in the news
The annual Malofiej Awards is the big one for infographics in the news.…
-
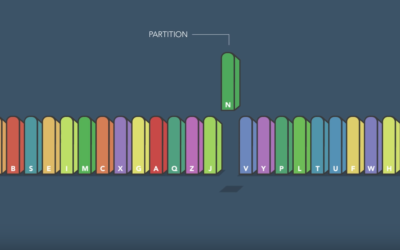
Fastest way to alphabetize your bookshelf
Sorting algorithms. Apparently there are an endless number of ways to visualize them…
-
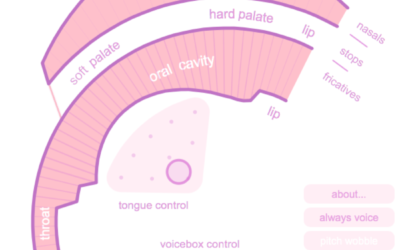
Simulation shows how your mouth works when you talk
You have a mouth with a bunch of tissue in it and manipulate…
-
Shifting national budget
The Washington Post looks at the shifting national budget over the past 40…
-
Data visualization GIFs
The nice thing about animated GIFs for visualization is that they can get…
-
Visa restrictions and possible impact on innovation
The Washington Post talked to three experts on the American workforce and innovation…
-
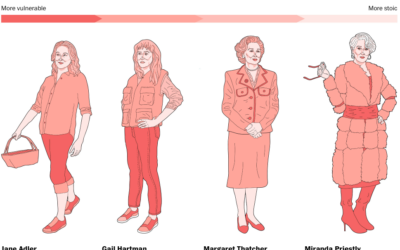
The range of Meryl Streep
Here’s a fun piece from Stephanie Merry and Shelly Tan for The Washington…
-
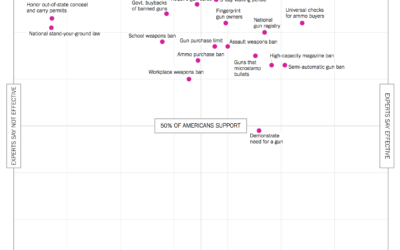
Public versus experts, gun control
With this scatterplot, Quoctrung Bui and Margo Sanger-Katz for The Upshot describe where…
-
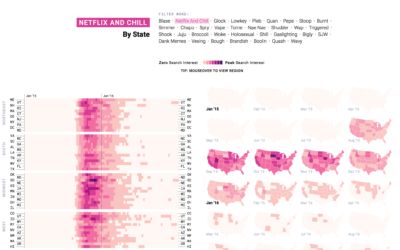
Language in 2016, seen through Google Search Trends
People go to Google to find information about things, and when new words…
-
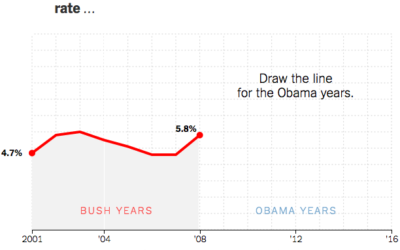
Draw the patterns of Obama’s presidency
A couple of years back The New York Times asked readers to draw…
-
History of data visualization
I have an affinity for new things designed as old things, so this…
-
National Geographic Infographics, the book
Infographics devolved a bit in recent years, but there was a time the…
-
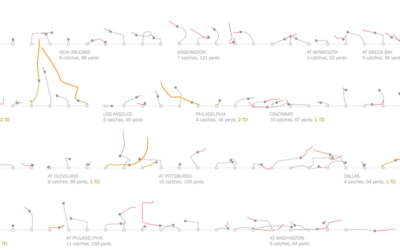
Football catches visualized
It’s always fun to go back to sports articles and graphics that were…
-
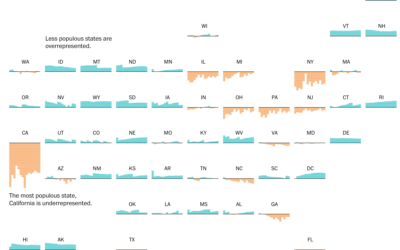
Electoral college and state population representation weights
By design, the electoral college and population don’t quite match up state-by-state. This…





 Visualize This: The FlowingData Guide to Design, Visualization, and Statistics (2nd Edition)


