We all know Twitter has taken on a life of its own. With…
Nathan Yau
-
Possible Futures of Twitter Visualized
-
Déjà Poo: Turning Wastewater to Nonpotable Water
This infographic from Wired explains how Living Machines work to combine waste management…
-
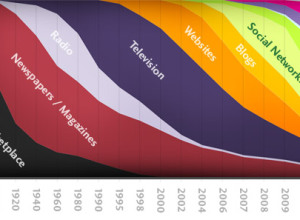
What’s Wrong With this Graphic on the Future of Information?
This graphic on the history and future of information has been making the…
-
11 Informative (and Fun) Infographics About Beer
It’s Friday. It’s summer. It’s time to relax in the backyard with an…
-
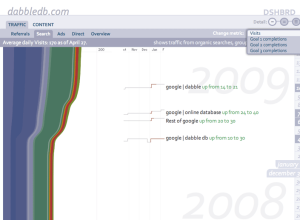
Google Analytics Data Made More Informative
A large majority of us who have websites use Google Analytics as our…
-
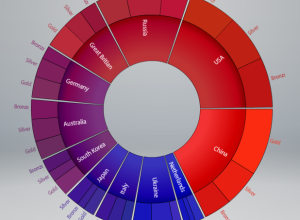
Worldwide Obama Buzz Visualized
In celebration of Barack Obama’s 100th day as the 44th President of the…
-
Open Source Data Visualization Framework – Axiis
Axiis, an open source data visualization framework in Flex, was released a few…
-
POLL RESULTS: What Data-related Area Are You Most Interested In?
A couple weeks ago I asked you what data-related area you’re most interested…
-
Data.gov is Live – Get Your Data While it’s Hot
Big news. Data.gov is now live. Government data is at your fingertips.
The… -
Indieprojector Makes it Easy to Map Your Geographical Data
Axis Maps recently released indieprojector, a new component to indiemapper, their in-development mapping…
-
Offline For a Couple of Days
Quick announcement: I’m offline for a couple of days to attend my sister’s…
-
Best of FlowingData: May 2009
I know a lot of you are new to FlowingData, so here are…
-
Thank You to the FlowingData Sponsors
I always chuckle a little bit whenever I get an email from someone…
-
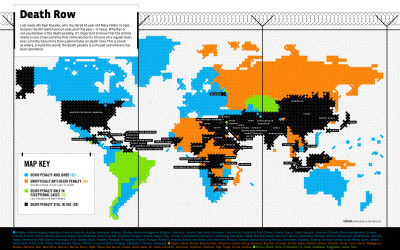
Death Penalty Laws Around the World
With their usual flare, GOOD Magazine maps the death penalty around the world…
-
Pixel City: Computer-generated City
Pixel City is a procedurally-generated city by Shamus Young. For the non-coders out…
-
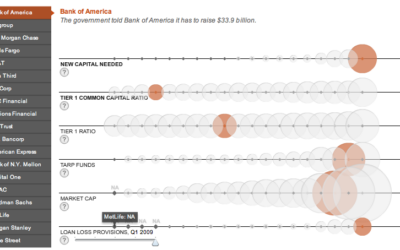
Bubbles Galore in Analysis of Banks’ Financial Health
Andrew Garcia Phillips and Stephen Grocer of The Wall Street Journal compare the…
-
Maps of the Seven Deadly Sins
Geographers from Kansas State University map the spatial distribution of the seven deadly…
-
50 Cars to Make One Bus?
Flygbussarna, a Swedish coach bus company, in partnership with the Acne marketing group,…
-
Interaction Design Pilot Year Churns Out Great Student Projects
In a collaborative initiative between Copenhagen Institute of Interaction Design and The Danish…
-
POLL: What Data-related Area Are You Most Interested In?
It’s time for a FlowingData poll. I want to know what data-ish things…
Recently for Members
Second Edition
 Visualize This: The FlowingData Guide to Design, Visualization, and Statistics (2nd Edition)
 Visualize This: The FlowingData Guide to Design, Visualization, and Statistics (2nd Edition)
New tools, refined process.
Browse by Chart Type See All →


