“the more academic papers that economists read, the more misguided they’ll become”
Nathan Yau
-
Link
How economists get tripped up by statistics →
-
Link
Underscore.Nest →
Convert flat data into nested tree structures
-
Data plural versus data singular
Kevin Drum on data is or data are:
Now, I know that lots… -
The future of maps isn’t maps →
Rebecca Rosen for The Atlantic on why maps aren’t the best interface all…
-
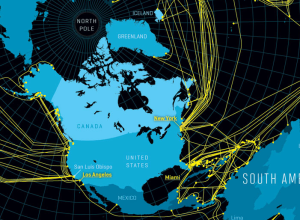
Map of the underwater Internet →
Nicolas Rapp, for Fortune Magazine, mapped the underwater cables that make the global…
-
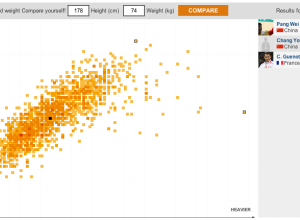
Where you measure up against Olympians →
I think the theme of this year’s Olympic graphics is how you relate…
-
Link
A Criticism of Visualization Criticism Criticism →
Robert Kosara’s response to this
-
Link
Data Quotes →
Some fun ones
-
Link
Newspapers running out of time →
Rundown of the struggling state of those rooted in the paper medium
-
Link
The Act of Creating Scientific Data Visualizations →
Process behind a couple of Periscopic pieces with non-profit organization, on endangered species
-
Link
Future of Visualization →
“will need to scale in terms of performance, density, and interactivity”
-
Link
What if? →
New weekly from xkcd, answering all the important questions of the universe
-
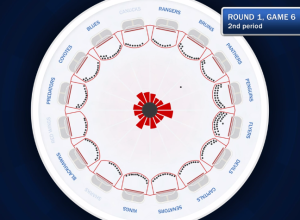
Sonification of Stanley Cup goals →
Artist Bard Edlund sonified the goals during the 2012 Stanley Cup.
The goals… -
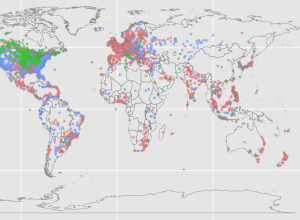
Soda versus pop on Twitter →
Edwin Chen, a data scientist at Twitter, explored the geographic differences in language…
-
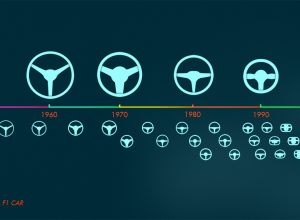
Evolution of the Formula One car, animated
Animator and illustrator Rufus Blacklock animated 60 years of Formula One race car…
-
Link
Mr. Miyagi and statistics education →
Unlike Daniel LaRusso, most students need context for the importance and meaning of concepts to soak through [via]
-
Link
How to read a topographic map →
You know, the one with all the lines and shading
-
Link
Google launches indoor maps →
For airports, shopping, and such
-
Link
Children can do stats, probably →
Researchers trying to get kids to understand randomness
-
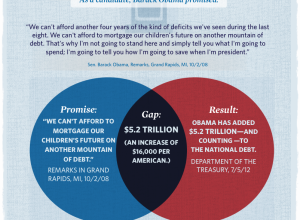
Mitt Romney pseudo-venn diagram, used incorrectly
The Mitt Romney campaign put this venn diagram up a few days ago,…
Recently for Members
Second Edition
 Visualize This: The FlowingData Guide to Design, Visualization, and Statistics (2nd Edition)
 Visualize This: The FlowingData Guide to Design, Visualization, and Statistics (2nd Edition)
New tools, refined process.
Browse by Chart Type See All →


