Proposal for moving the field forward
Nathan Yau
-
Link
Visualization progress →
-
Link
Scatter plots and heat maps in Illustrator →
Well, pseudo heat maps anyway
-
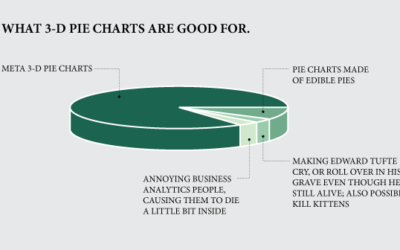
What 3-D pie charts are good for
3-D pie charts are never a good idea? Ha. You just got served.…
-
Link
Nigel Holmes influences →
Includes Thelonious Monk, Powers of 10, and some atlas
-
Link
Basketball shooting data →
An easy-to-download source used in the recent basketball court geographies [via]
-
Profile of the Facebook Data Science Team
MIT Technology Review profiles the Facebook Data Science Team, described as a gathering…
-
Link
What Facebook Knows →
Profile of the data science team and their pot of gold
-
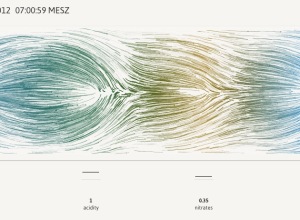
River flow simulation
In Newcastle, there’s a floating tide mill building on the River Tyne. The…
-
Link
Designing An Amazing Infographic →
Would add analysis in there, but that never seems to be included
-
Link
10 seconds rule →
The notion that you have to understand a graph right away only applies to a certain kind of graphic
-
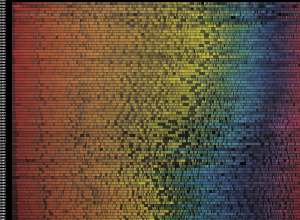
Evolution of movie poster colors
We’ve seen a number of looks at movie poster cliches, but this is…
-
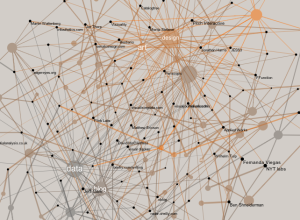
Network of data visualization references
Developer Santiago Ortiz explores visualization references through Delicious tags and puts them in…
-
Link
Designing data →
It seems kind of out of place on the Typekit blog, but a pretty good rundown of the charting basics
-
Link
Bubble Chamber →
Impressive demos from Robert Hodgins’ talk at Eyeo, plus code on GitHub
-
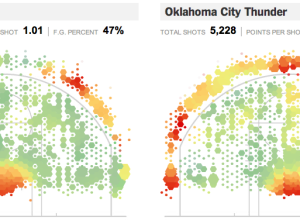
Geography of the basketball court, interactive edition
Remember geographer Kirk Goldsberry’s analysis of shot efficiency on the basketball court? Jeremy…
-
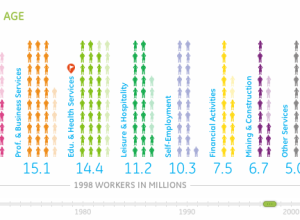
Working in America over the decades
Information visualization firm Periscopic, in collaboration with GE, explores the makeup of the…
-
Link
Binning: An Alternative to Point Maps →
Avoid clutter caused by too many dots in one place
-
Link
Data Science Certificate →
For “real-life scenarios” [via]
-
Link
DataKind Goes Full-time →
With Jake Porway leading the way, there’s no doubt the blooming organization is headed for great things.
-
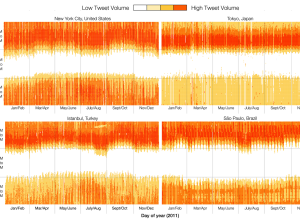
When the world sleeps, based on Twitter activity
Twitter engineers Miguel Rios and Jimmy Lin explored tweet volumes in different cities…
Recently for Members
Second Edition
 Visualize This: The FlowingData Guide to Design, Visualization, and Statistics (2nd Edition)
 Visualize This: The FlowingData Guide to Design, Visualization, and Statistics (2nd Edition)
New tools, refined process.
Browse by Chart Type See All →


