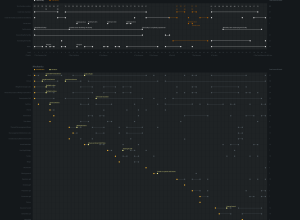
I’ve never played Portal 2 (or the first), but I suspect some of…
Nathan Yau
-
Portal 2 timelines →
-
Link
Review of Tufte one-day course →
Kosara didn’t like it, which is what I expected
-
Track and field Olympic performances in perspective →
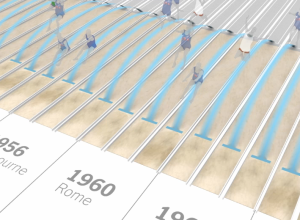
We’ve been hearing Olympic records rattled off for the past week, but it’s…
-
Link
Get heart rate using R and Ruby →
Grab data from webcam or phone camera, and then analyze
-
Link
three.js →
A JavaScript 3-D library with impressive demos
-
Link
What Data Scientists Can Learn From Data Artists →
Martin Wattenberg knows what he’s talking about
-
Fox News continues charting excellence
Fox News tried to show the change in the top tax rate if…
-
Link
Twitter Flu Trends →
Like the Google version, predicts when the flu will hit
-
Olympic rings as data symbols
Artist Gustavo Sousa used the Olympic rings as data indicators for statistics like…
-
What planets would look like if they replaced our moon
Artist Brad Goodspeed imagined what the planets would look like if they were…
-
Link
How the Public Uses Local Government Maps →
“less GIS and a lot more user-friendly auto-complete and SEO”
-
Link
G-Analytics →
Helping governments share ideas on how to make use of open data
-
Link
Efficient JavaScript vector math →
Get it running smoothly
-
Link
Edge Prediction in a Social Graph →
I like how a Twitter data scientist is working on a Facebook challenege
-
Twitter Political Index measures feelings towards candidates
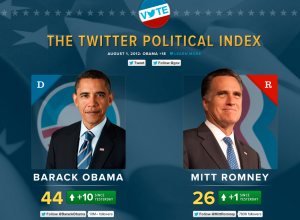
In partnership with social analytics service Topsy, Twitter launched a Political Index that…
-
Nigel Holmes on explanation graphics and how he got started
Some consider Nigel Holmes, whose work tends to be more illustrative, the opposite…
-
Link
Text Processing Excursion →
Working from the command line [via]
-
Link
Why science really needs big data →
“big data is becoming more pervasive to society”
-
Link
Data Visualization: It’s Pretty, but Is It Useful? →
Author is misguided and clearly doesn’t work with data
-
Link
Is algebra necessary? →
Maybe we should get rid of reading and writing, too


 Visualize This: The FlowingData Guide to Design, Visualization, and Statistics (2nd Edition)


