Not that anyone who does not vaccinate their kids cares, but Tynan DeBold…
Nathan Yau
-
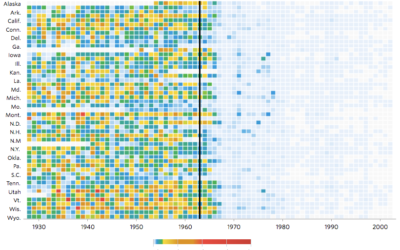
Impact of vaccines throughout history
-
Loading Data and Basic Formatting in R
It might not be sexy, but you have to load your data and get it in the right format before you can visualize it. Here are the basics, which might be all you need.
-
Automated Tinder and the Eigenface
Because using Tinder takes up oh so much time swiping, swiping, and swiping,…
-
Seagull skytrails
Watch one bird fly around, and it’s hard to make out its flight…
-
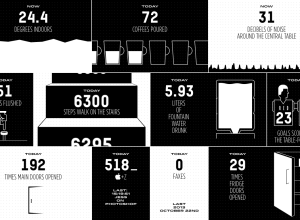
Real-time dashboard for office plumbing
The Sid Lee agency in Paris has Arduino-powered sensors hooked up throughout their…
-
Audio landscape
Audio Landscape is a novel music visualizer that constructs a landscape based on…
-
Not just one chart
There is no more reason to expect one graph to “tell all” than…
-
Algorithm-generated song, based on income data
In the first song of his music experiment Data-Driven DJ, visual artist Brian…
-
Visualization constraints
In a discussion of context and visualization, Jen Christiansen pulls out a good…
-
Trust engineers
The most recent episode of RadioLab is on social experimentation and social networks.…
-
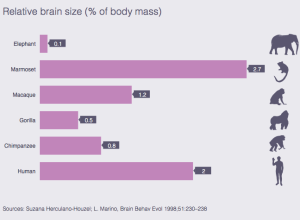
Human brain size compared to animals’
Mosaic provides a simple comparison of brain size in a handful of animals…
-
Pac-Man ghost algorithms
The ghosts in Pac-Man have different personalities represented by their search technique. For…
-
Job gains and losses over time
Andrew Van Dam and Renee Lightner for the Wall Street Journal provide a…
-
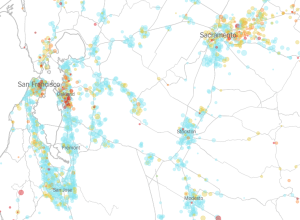
Vaccination rates for every kindergarten in California →
The New York Times mapped the vaccination rate for every kindergarten in California.…
-
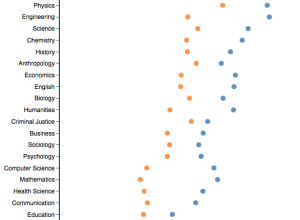
Professor ratings by gender and discipline
Based on about 14 million reviews on RateMyProfessor, this tool by Ben Schmidt…
-
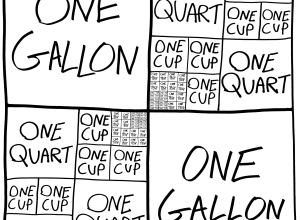
Baking units demystified
A handy chart by Andrew M.H. Alexander. Treemap conversion from one gallon, down…
-
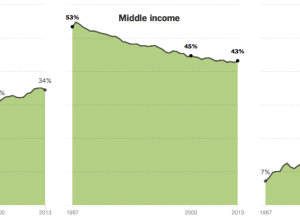
Shrinking middle class
The Upshot has a detailed, chart-filled summary of the shrinking middle class, categorized…
-
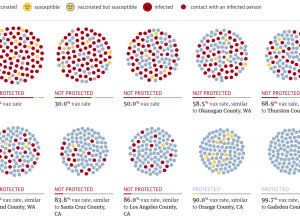
Vaccination rate and measles outbreak simulation
You’ve probably heard about herd immunity by now. Vaccinations help the individual and…
-
Compare Worst and Best Commutes in America
See who has it worse off and better than you.
-
Where and why men outnumber women
There are an estimated 60 million more men than women on this planet,…







 Visualize This: The FlowingData Guide to Design, Visualization, and Statistics (2nd Edition)


