Baby-Making Age
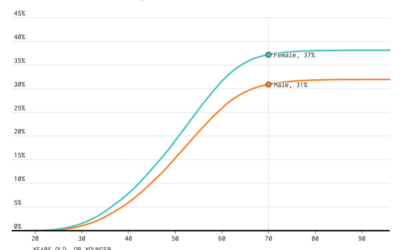
We looked at prime dating age and when people usually marry. Now it’s time for the next step in the circle of life. Here’s the percentage of people who had at least one child, given their age.
The percentages are based on the most recent 2015-2017 release from the National Survey of Family Growth (NSFG), which is run by the Centers for Disease Control and Prevention (CDC).
As expected, the percentage of those who are parents rises with age, and the half-way point was younger for women than for men. This makes sense, because women tend to marry at a younger age.
One interesting tidbit worth looking at more closely: The half-way point for women marrying is 28 years old, whereas the half-way point for having at least one child is 26. I expected it to be the other way around, but there are enough pre-marriage births to flip things.
Become a member. Support an independent site. Get extra visualization goodness.
See What You Get


