A previously banned Disney cartoon on menstruation. So informative.
[Thanks, Kevin]…
A previously banned Disney cartoon on menstruation. So informative.
[Thanks, Kevin]…
After a couple of weeks of phone-only Internet, I’ve got my hands on…
Hacks/Hackers event in Cambridge, MA: 5/30 at 6pm
Open source, open data, open visualization?

Open data is everywhere. However, open data initiatives often manifest as mere CSV…
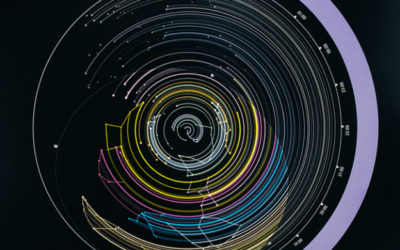
I’m a little dense when it comes to astronomy, but I think I…
Suggests plotting density, not points
Hysterical TEDx talk about words using Google n-grams for research
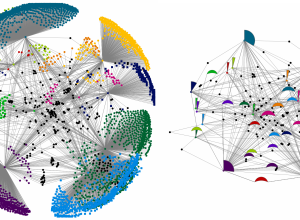
Network diagrams are notoriously messy. Even a small number of nodes can be…
A graph visualization library using web workers and jQuery
Last week I attended the 29th annual symposium at the Human-Computer Interaction Lab…
Upload and analyze location data from OpenPaths
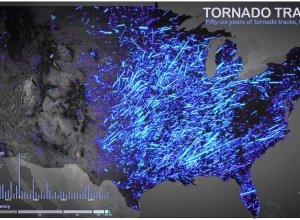
John Nelson of IDV Solutions put 56 years worth of tornadoes on a…
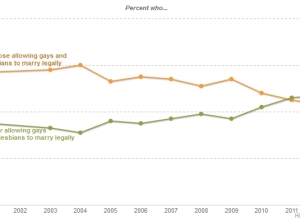
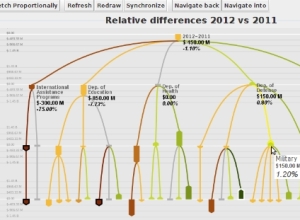
Regardless of your politics, this chart is a great example of how data…
An open-source lightweight JavaScript library to draw graphs
What does the geography of incarceration in the US look like?
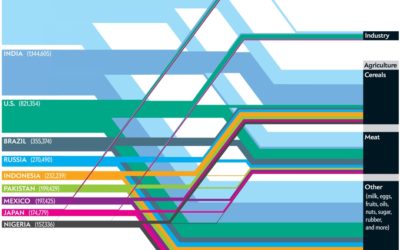
This Scientific American article by Mark Fischetti and infographic by Jen Christiansen detail…
This is a dataset, here are some free tools, now be a data journalist
From The Guardian
Recently there’s been a spate of infographic tools popping up (e.g., easel.ly, venngage,…
 Visualize This: The FlowingData Guide to Design, Visualization, and Statistics (2nd Edition)
New tools, refined process.


