One year into these tariffs, Ana Swanson for the New York Times has…
Statistical Visualization
Finding patterns, distributions, and anomalies.
-
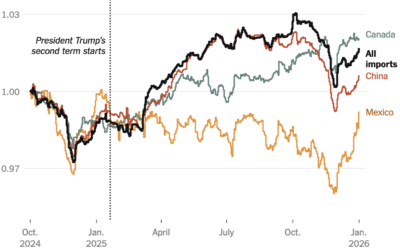
Impact of tariffs on cost of goods
-
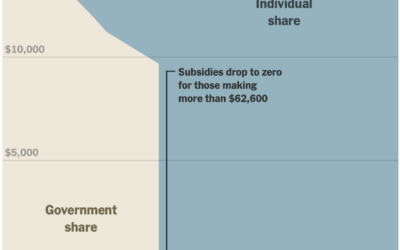
Financial cliff of health subsidies
In January, the scale for U.S. healthcare subsidies changed, which reintroduced a cliff.…
-

Cumulative measles rising with South Carolina outbreak
In 2000, measles in the United States was declared eliminated by the World…
-

Cuts to science and research in the U.S. over the past year
The administration cut science funding, withheld grants, and eliminated jobs in research areas…
-

Pentagon Pizza dashboard to track activities
There is a dashboard for pizza places around the Pentagon.
The Pentagon Pizza… -

How much temperatures increased where you live
He hear global warming and it seems like a monolithic thing that is…
-

Yeah, still getting hotter
You probably don’t need me to tell you this, but recent data suggests…
-

Job cuts for every federal agency
Based on November data released by the Office of Personnel Management, the federal…
-

Pizza declines in the U.S.
With more choices for a quick bite, the market share for pizza in…
-

Prediction market for all the things is mostly sports, but they don’t talk about that
Kalshi is a prediction market that aims to let users bet on everything.…
-

DOGE claims against reality
The farce that was DOGE made claims of heavy savings and government efficiency.…
-

Best and worst decades of life are in the present
YouGov asked people when they think will be the best years of their…
-

Online gambling brings in billions through state taxes
There are seven states that legalized gambling on your phone. So you can…
-

Highlighting historical visualization
Michael Friendly, known for piecing together the history of visualization, chatted with Cabinet…
-

Rising cost of streaming
The cost of streaming services keeps going up. There are plans with and…
-

Towards zero traffic fatalities
Speaking of traffic fatalities, Helsinki is doing things differently. Amanda Shendruk for Not-Ship…
-

Growing political contributions from billionaires
The Washington Post examined political contributions from the 100 wealthiest Americans, which have…
-

Shifts left for every demographic group, 2025 elections
G. Elliot Morris, for Strength in Numbers, breaks down the shift towards Democrat…
Recently for Members
Second Edition
 Visualize This: The FlowingData Guide to Design, Visualization, and Statistics (2nd Edition)
 Visualize This: The FlowingData Guide to Design, Visualization, and Statistics (2nd Edition)
New tools, refined process.
Browse by Chart Type See All →


