I trust we've all seen the OldSpice YouTube campaign by now? This graphic from Know Your Meme categorizes videos by who they were directed to and how many views they received. For example, a video to Joe Blow would be in the low-profile category, while responses to Alyssa Milano go to the high-profile category.
Continue Reading
2010 September
-
Discuss: Graphs on Old Spice YouTube campaign
-
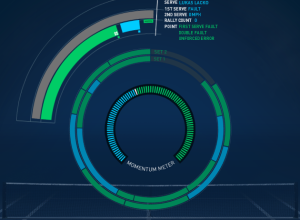
Real-time match display for the US Open
The tennis US Open is in full swing, and since you're at work, you probably need a way to keep up with all of the matches. In a collaboration between the US Open and IBM, this real-time display shows you what's going on during any given match.
Continue Reading -
FlowingData is brought to you by…
A big thank you to FlowingData sponsors for their support. They help me keep the lights on. Check 'em out. They help you understand your data.
Splunk - Leading software used to monitor, report and analyze live streaming IT data as well as terabytes of historical data – located on-premise or in the cloud. More than 1,850 organizations in 70 countries use Splunk to gain valuable insights from their IT data.
Tableau Software - Combines data exploration and visual analytics in an easy-to-use data analysis tool you can quickly master. It makes data analysis easy and fun. Customers are working 5 to 20 times faster using Tableau.
Want to sponsor FlowingData? Email me for details.
-
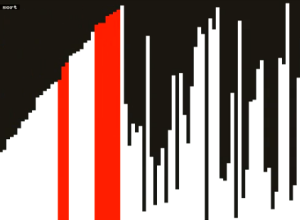
What different sorting algorithms sound like
Last month we saw sorting algorithms visualized in rainbow technicolor. Now, by Rudy Andrut, here they are auralized.
This particular audibilization is just one of many ways to generate sound from running sorting algorithms. Here on every comparison of two numbers (elements) I play (mixing) sin waves with frequencies modulated by values of these numbers. There are quite a few parameters that may drastically change resulting sound - I just chose parameteres that imo felt best.
It sounds like someone is playing on old Atari game. Warning: may cause seizures. Watch it in action in the video below.
Continue Reading


The Best Data Visualization Projects of 2011
What Facebook knows about you
Where are the biggest box office movies (not) streaming?
High-resolution maps of science
Backbone of the flavor network
Vehicles involved in fatal crashes
Cinemetrics creates a visual fingerprint for movies
Visualize This