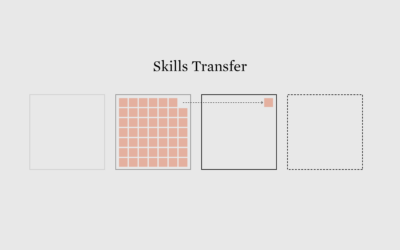
This week we imagine what we would do if the tool we relied on the most were to disappear.
tools
-
Members Only
Translating Visualization Steps
-
Catalog of AI data tools
Meant to be comprehensive more than a curated collection, the Journalist’s Toolbox AI…
-
Members Only
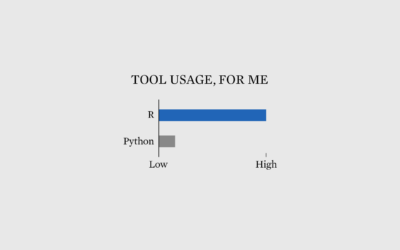
Why I Use R More than Python
Debates about which is best are useless. Go with what works for you, and never mind the rest.
-
Members Only
Visualization Integration
If you want to maximize fun, a mixed toolbox is still best.
-
Members Only
When I Switched Visualization Tools
With all the new tools available, maybe it’s time to add to the existing toolset.
-
Members Only
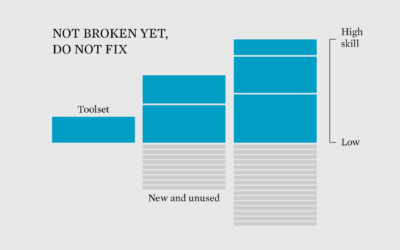
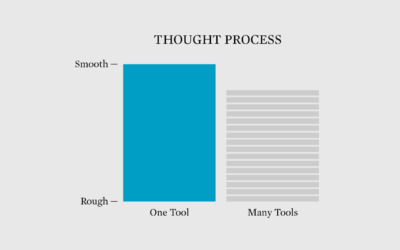
Learning to Use One Visualization Tool Really Well
There are many tools, which makes it tempting to learn them all. Instead, learn one tool really well and the logic carries over to the others.
-
Members Only
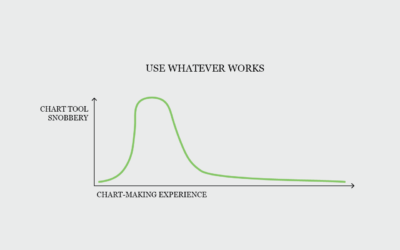
Chart Tool Snob
Use the tool that works for you.
-
Members Only
Finding New Visualization Tools for a New Point of View – The Process 171
It’s time to bask in the joys of knowing nothing again.
-
Members Only
Not the Best List of Visualization Tools – The Process 164
All the tools are a product of visualization’s many uses, which isn’t so terrible. But not all the tools are champions.
-
Members Only
The Process 103 – End Result
Last month I did a short Q&A about FD and my workflow. I thought I’d elaborate on one of my answers.
-
Members Only
Small Tools for Visualization (The Process 101)
We know the big ones. Now here are the small ones. Focused. Efficient.
-
Members Only
The Best Visualization Course I Ever Took; Membership Update with New Points of View (The Process #65)
This week I reminisce back to when I didn’t know anything about visualization, and all I wanted to do was solve analysis problems. Also, some fun updates on the way, exclusively for members.
-
Members Only
Select Your Weapon (The Process #48)
Some people love the Tidyverse in R. Others are less fond of it. For me, the more tools the better.
-
Members Only
Visualization Tools, Datasets, and Resources – March 2019 Roundup (The Process #34)
Every month I collect practical resources, new tools, code, and datasets. Here’s the good stuff for March.
-
Members Only
Visualization Tools, Datasets, and Resources – February 2019 Roundup
Throughout the month I collect new tools for data and visualization and additional resources on designing data graphics. Here’s the new stuff for February.
-
Members Only
Visualization Tools, Datasets, and Resources – January 2019 Roundup
Throughout the month I collect new tools for data and visualization and additional resources on designing data graphics. Here’s the new stuff for January.
-
Members Only
Practicing with a Visualization Toolbox, Tools and Additional Resources Roundup – September 2018
If you’re trying to learn how to work with data, make time to fiddle with the toys in your growing toolbox. Otherwise, you just have a bunch of bookmarks and no new skills.
-
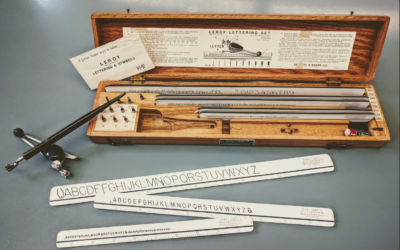
Visualization in the 1980s, just before the rise of computers
Graham Douglas, a data journalist at The Economist, looks back on the days…
-
Members Only
Better than Default
Defaults are generalizations to fit many datasets, which means you usually get barebone charts. For analysis, all well and good. However, data graphics for presentation require more care after the initial output.
-
Members Only
Wrong Tool, Right Tool, More Tools for Visualization
Welcome to the new members-only newsletter: The Process. In this first update, a certain data graphics expert seems to really dislike R, which prompts a look into the visualization tools we use and what one might get out of a bigger toolbox.






 Visualize This: The FlowingData Guide to Design, Visualization, and Statistics (2nd Edition)


