There’s a technical component of visualization that leans towards code, data formatting, and clicking the right buttons in the right order. Then there’s everything else that makes okay charts into something much better.
process
-
Members Only
Technical Know-How is Part One (The Process #70)
-
How data changes the design process at every stage
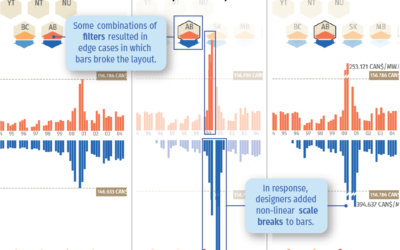
On Multiple Views, the Interactions Lab talks about their experience as a design…
-
Link
Over Heard: A design exploration of the On Being archive →
The process of building a client project with varied expectations along the way.
-
Link
2017 Chart Diary →
Adam Pearce, a New York Times graphics editor, provides the notes and thinking behind the charts he made during the year.
-
5 Tips for Learning to Code for Visualization
Here are some tips to get you started, based on my own experiences with R, and more recently, the JavaScript library d3.js.
-
Treating visualization as a process
Many people think of visualization as a plug-in tool that spits out something…
-
Data Points: What it’s like to write a book
As the publication of Data Points nears, I’m excited to hold it in…
-
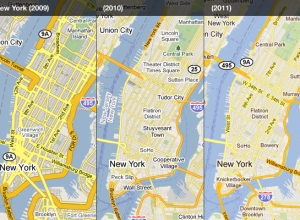
Designing Google Maps
Google Maps is one of Google’s best applications, but the time, energy, and…
-
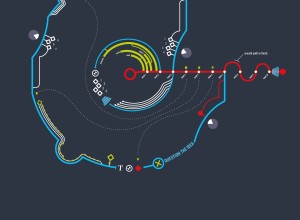
Picturing the creative process
The creative process changes by person and project, but there are obstacles and…

 Visualize This: The FlowingData Guide to Design, Visualization, and Statistics (2nd Edition)


