“Datalib is a JavaScript data utility library. It provides facilities for data loading, type inference, common statistics, and string templates.”
Resource Links
-
Datalib →
-
Awesome Public Datasets →
“This list of public data sources are collected and tidyed from blogs, answers, and user responses.”
-
More on Gestalt principles for visualization →
-
Purifying the Sea of PDF Data, Automatically →
Jeremy B. Merrill is working on the problem of too much data in PDF files. “My pattern solves this problem using tabula-extractor, the Ruby library (and command-line tool) that powers Tabula. It’s built to output data to CSVs or to a MySQL database.”
-
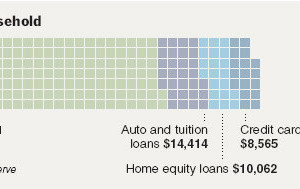
Making waffle charts in R →
An alternative to the pie chart to show proportions.
-
ArchieML →
“ArchieML (or ‘AML’) was created at The New York Times to make it easier to write and edit structured text on deadline that could be rendered in web pages, or more specifically, rendered in interactive graphics.” Less knowledge of markup language required.
-
7 command-line tools for data science
A quick list of command-line tools to putz around with data.
-
Vintage map design with QGIS
A quick, three-step tutorial on how to make maps that look vintage in the open source QGIS. [via]
-
NYPL map vectorizer
The NYPL map vectorizer turns old maps into GIS data.
-
A big collection of sites and services for accessing data
Andy Kirk put together a big collection of sites and services for accessing data. It’s essentially a big ol’ data dump.
-
R spells for data wizards
Thomas Levine provides a handful of useful tips for those getting started with R.
-
Statistics for Point Pattern Analysis in the Real World
Lillian Pierson provides a summary of methods to measure distance and clustering in a spatial context.
-
A Choropleth in QGIS
Xaquín G.V. has a dead simple tutorial on how to make a choropleth map with open source QGIS.
-
The Insanely Illustrated Guide to Your First Data-Driven TileMill Map
TileMill makes it easy to make custom maps. Here’s a detailed, illustrated tutorial on how to do that.
-
For Example
Mike Bostock, creator of D3, believes in using examples to show what can be done with his code.
-
NlpTools
NlpTools is a PHP library for natural language processing.
-
Polychart
Polychart just launched its open beta. “Lightweight visual analytics and business intelligence on the web.” Mainly, a drag-and-drop interface for quick charts.
-
Visualising data with ggplot2
Hadley Wickham gives a two-hour video tutorial on how to use his ggplot2 package in R. I have limited experience with it, but a lot of people really like it and use the package exclusively for their visual analysis needs.
-
Colour schemes
A bunch of color schemes and their corresponding hex codes.
-
Money on the Bench
The New York Times has a set of tickers that keep track of the money spent on players who are injured sitting on the bench.


 Visualize This: The FlowingData Guide to Design, Visualization, and Statistics (2nd Edition)


