Visualization
Showing the stories in data through statistics, design, aesthetics, and code.
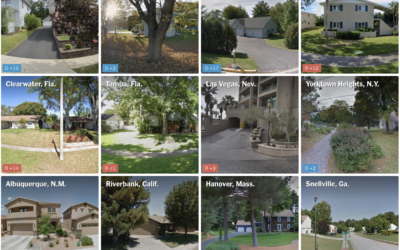
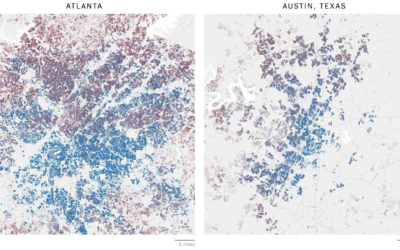
Guess who the neighborhood voted for
NYT’s The Upshot has a quiz that puts you in a neighborhood via…
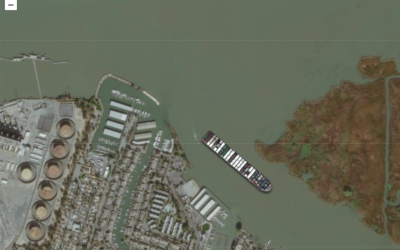
Make the Ever Given get stuck anywhere
The Ever Given got stuck in the Suez Canal. It was refloated. So…
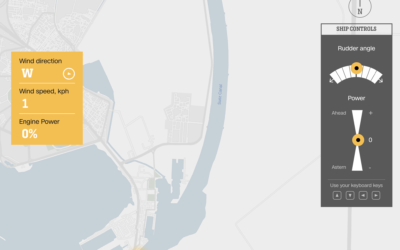
Steer through the Suez Canal
To better understand the challenge of steering a giant container ship through the…
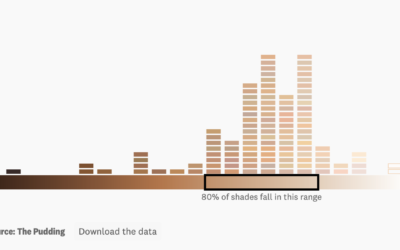
Analysis of color names used with makeup
For The Pudding, Ofunne Amaka and Amber Thomas looked at shades, words, and…

What if a giant banana was orbiting Earth
yeti dynamics imagined if a giant banana were orbiting Earth from the same…
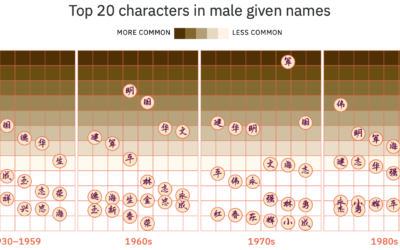
Evolution of Chinese names
For Kontinentalist, Isabella Chua took a dive into the evolution of Chinese names:…
Analysis of skin tones in beauty ads on Instagram
For Quartz, Amanda Shendruk and Marc Bain analyzed skin tones that appeared in…
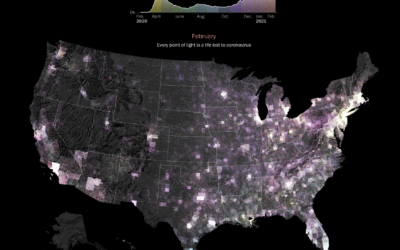
Pandemic timeline as animated dot density map
As a lead-in and backdrop to a timeline of the past year by…
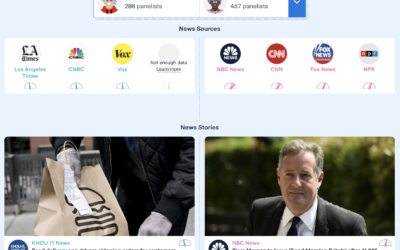
Facebook feed comparison between groups
As part of their Citizen Browser project to inspect Facebook, The Markup shows…
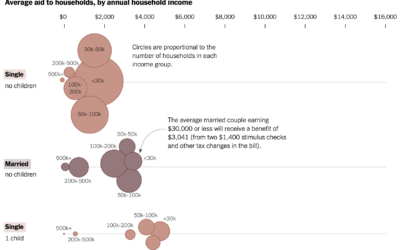
Average stimulus aid, by household size and income
Alicia Parlapiano and Josh Katz, reporting for NYT’s The Upshot, plotted the average…
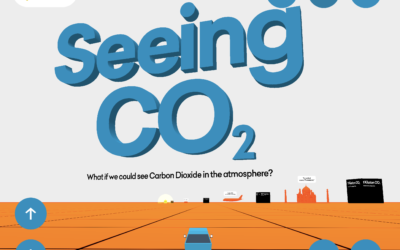
Seeing CO2 is a playable data visualization
Seeing CO2, by design studio Extraordinary Facility, is a playable data visualization that…
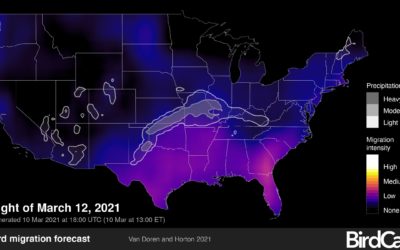
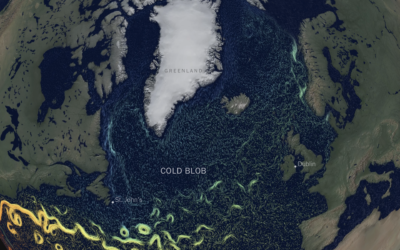
Bird migration forecast maps
BirdCast, from Colorado State University and the Cornell Lab of Ornithology, shows current…
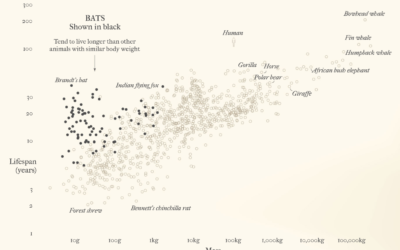
Bats and outbreaks
For Reuters, Julia Janicki and Simon Scarr, with illustrations by Catherine Tai, show…

Schools should open their windows for ventilation
As schools begin to reopen, The New York Times illustrates why classrooms should…
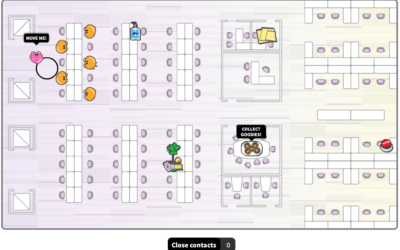
Social distancing when we’re back in the office
For Reuters, Sarah Slobin and Feilding Cage imagine life back at the office…
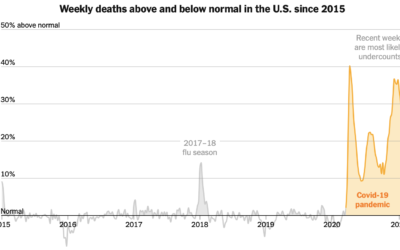
Scale of the pandemic compared to the past
While we’re on the topic of scale, The New York Times plotted weekly…