Marrying Later, Staying Single Longer
Everyone has their own timeline for marriage (if at all), and a number of factors can play a part, whether it be finishing an education, establishing a career, or finding the right person. But looking over the past century, as a whole, people are staying single longer and marrying later.
Using data from the decennial census and the American Community Survey, you can see this shift.
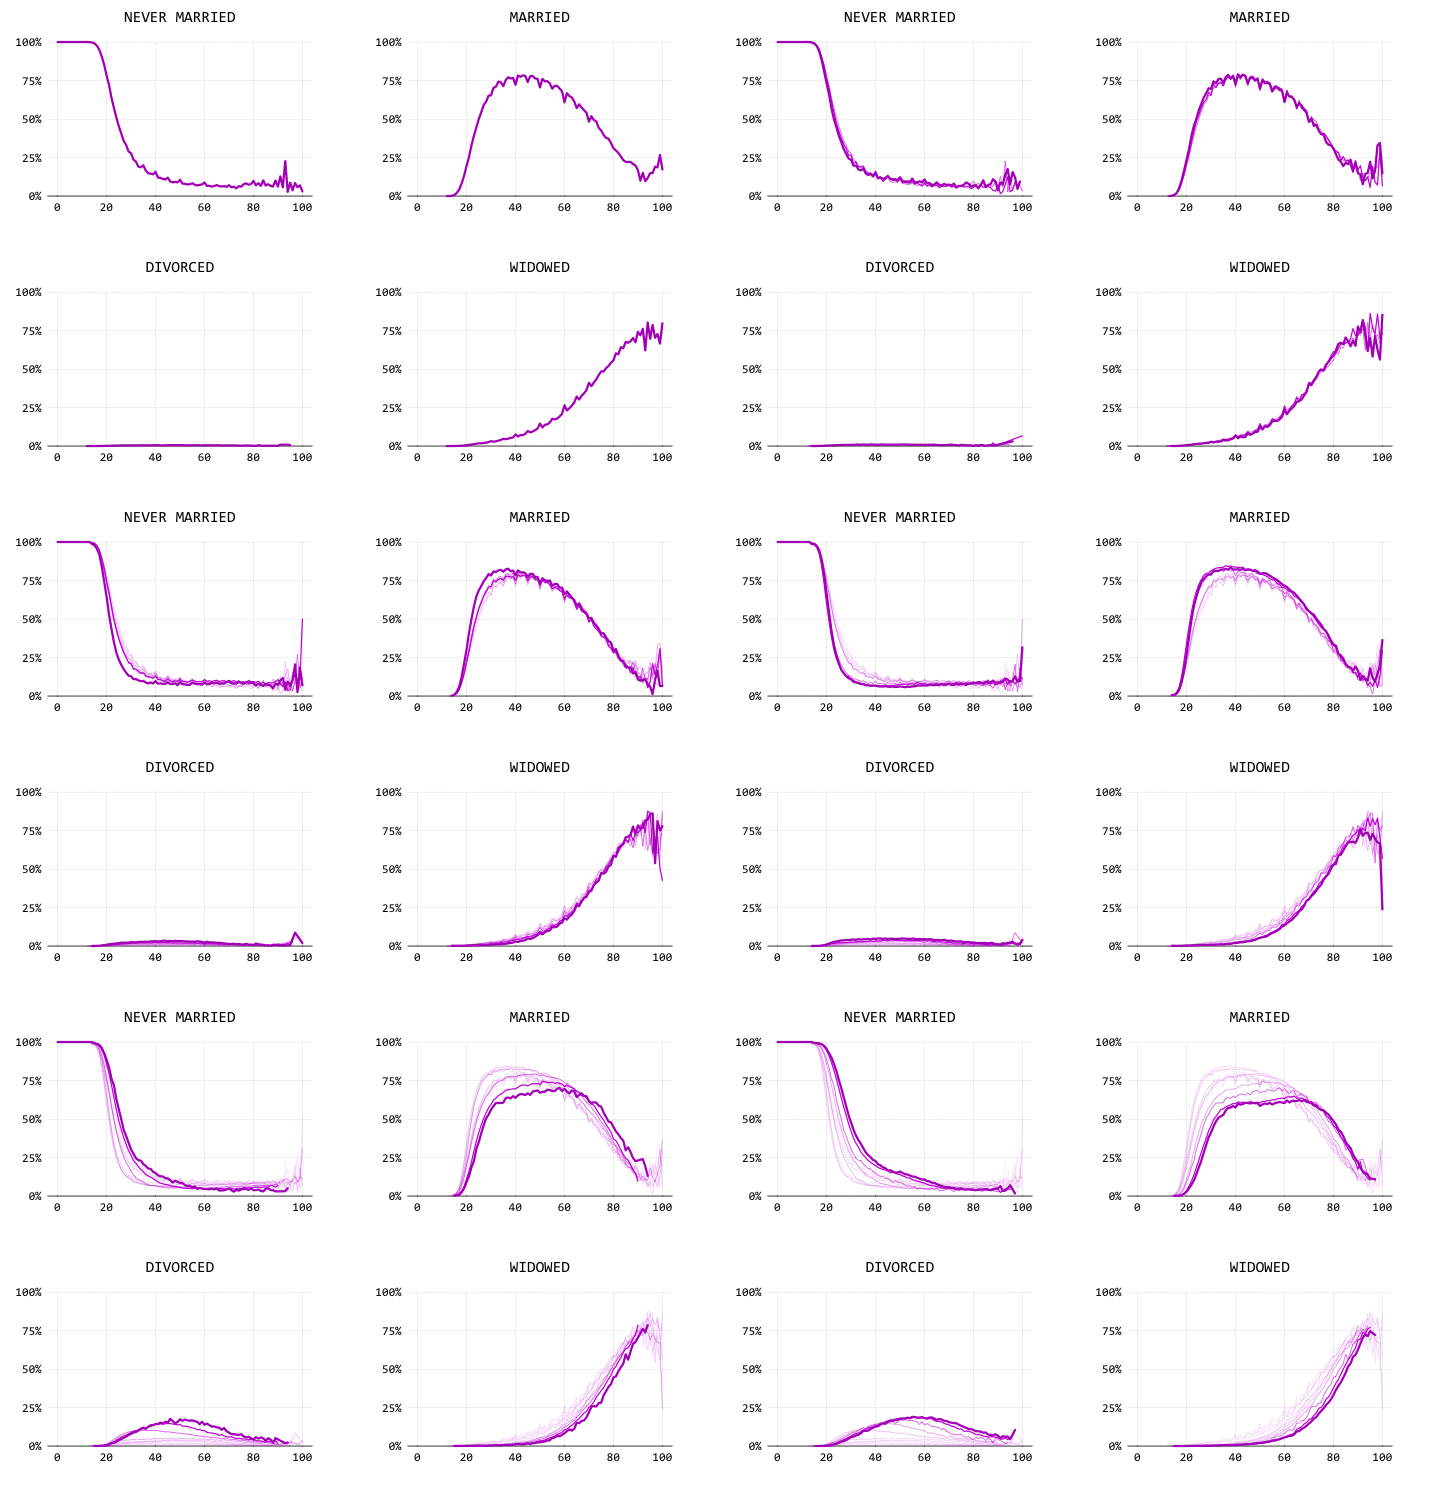
The charts that follow show the timelines in animated form. Each line represents the percentage of people with a certain marital status, given their age. The time span is every 10 years, from 1900 to 2010 and ending at 2015.
Never Married
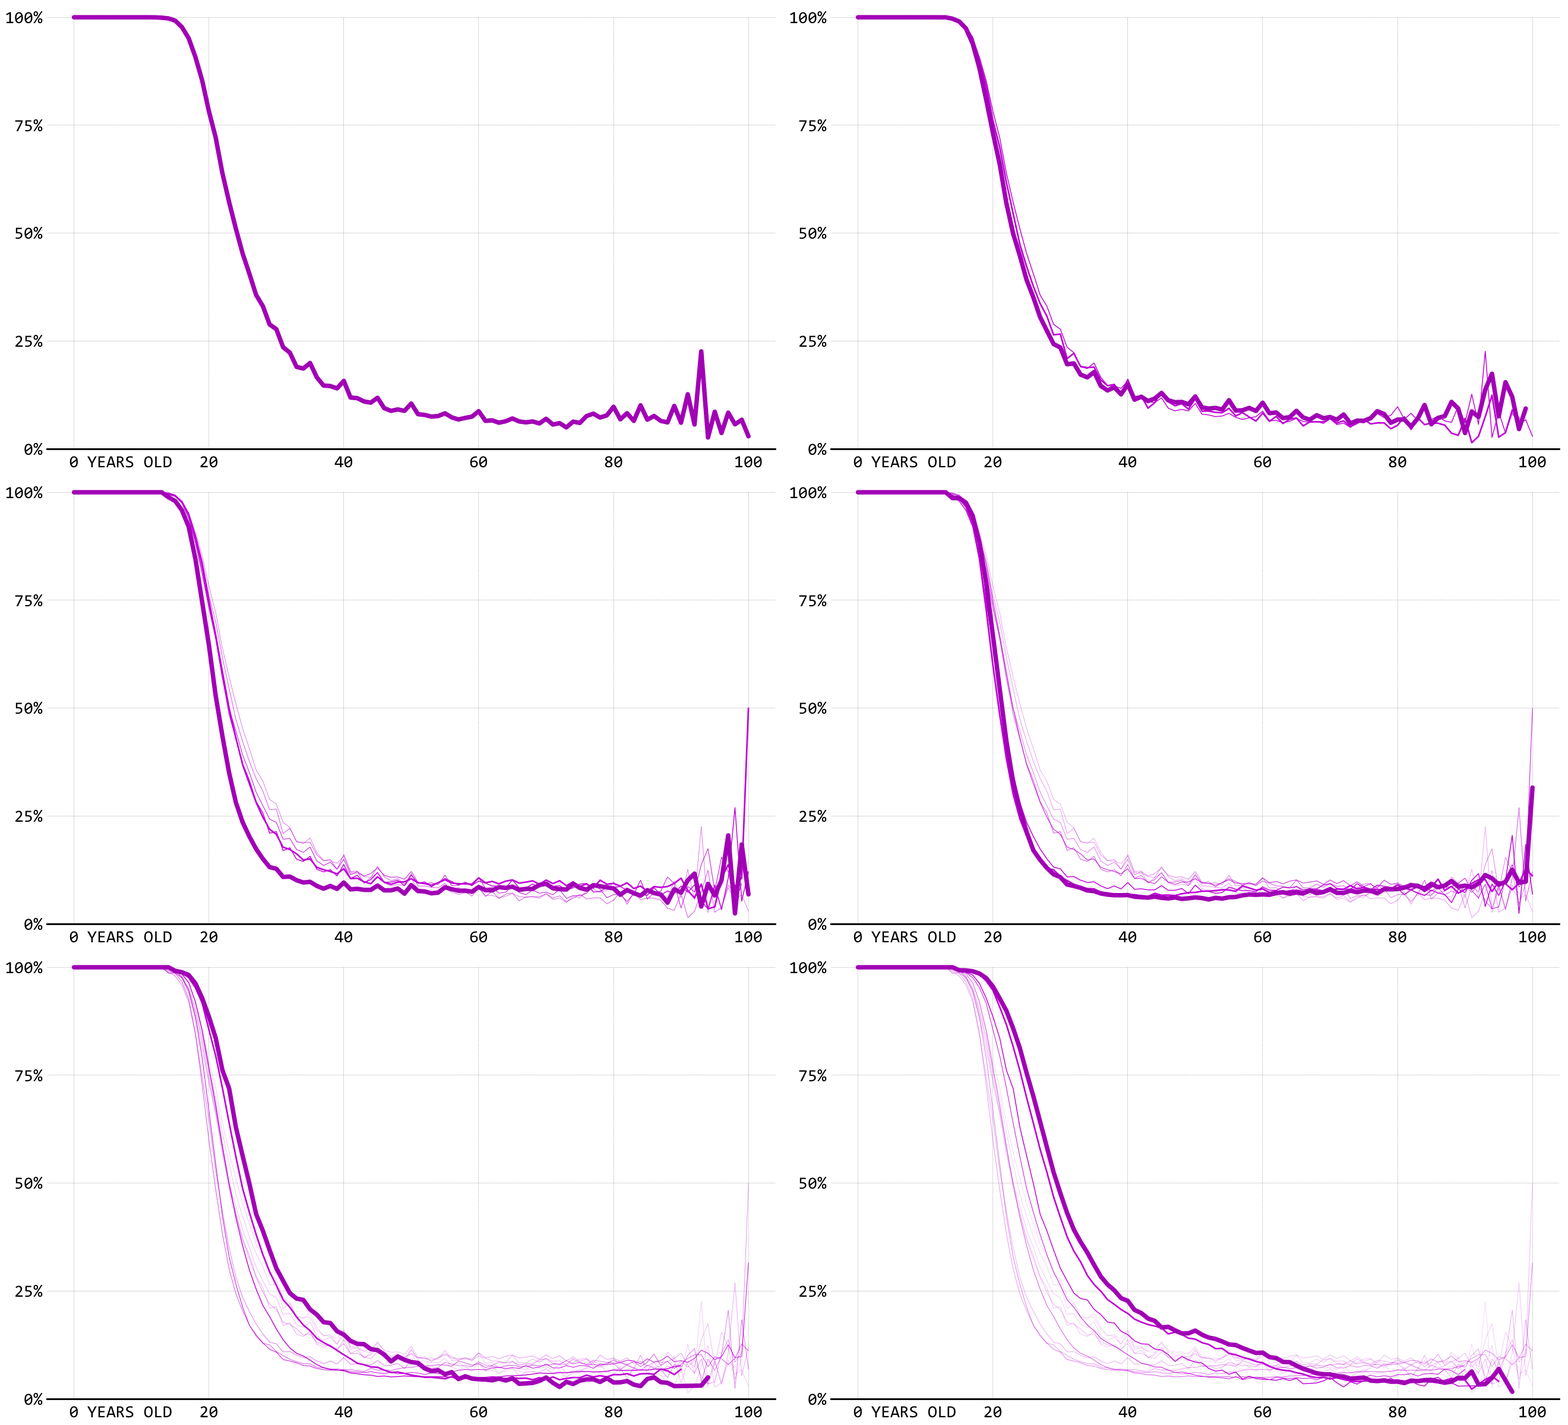
Over the full time span, the line shifts right and up, showing more people staying single for longer. However, in the early decades, you can also see a shift down and to the left, showing a shift towards marrying younger in the early 1900s. There’s also a lot of noise in the older ages, but that’s likely because of sample size.
Married
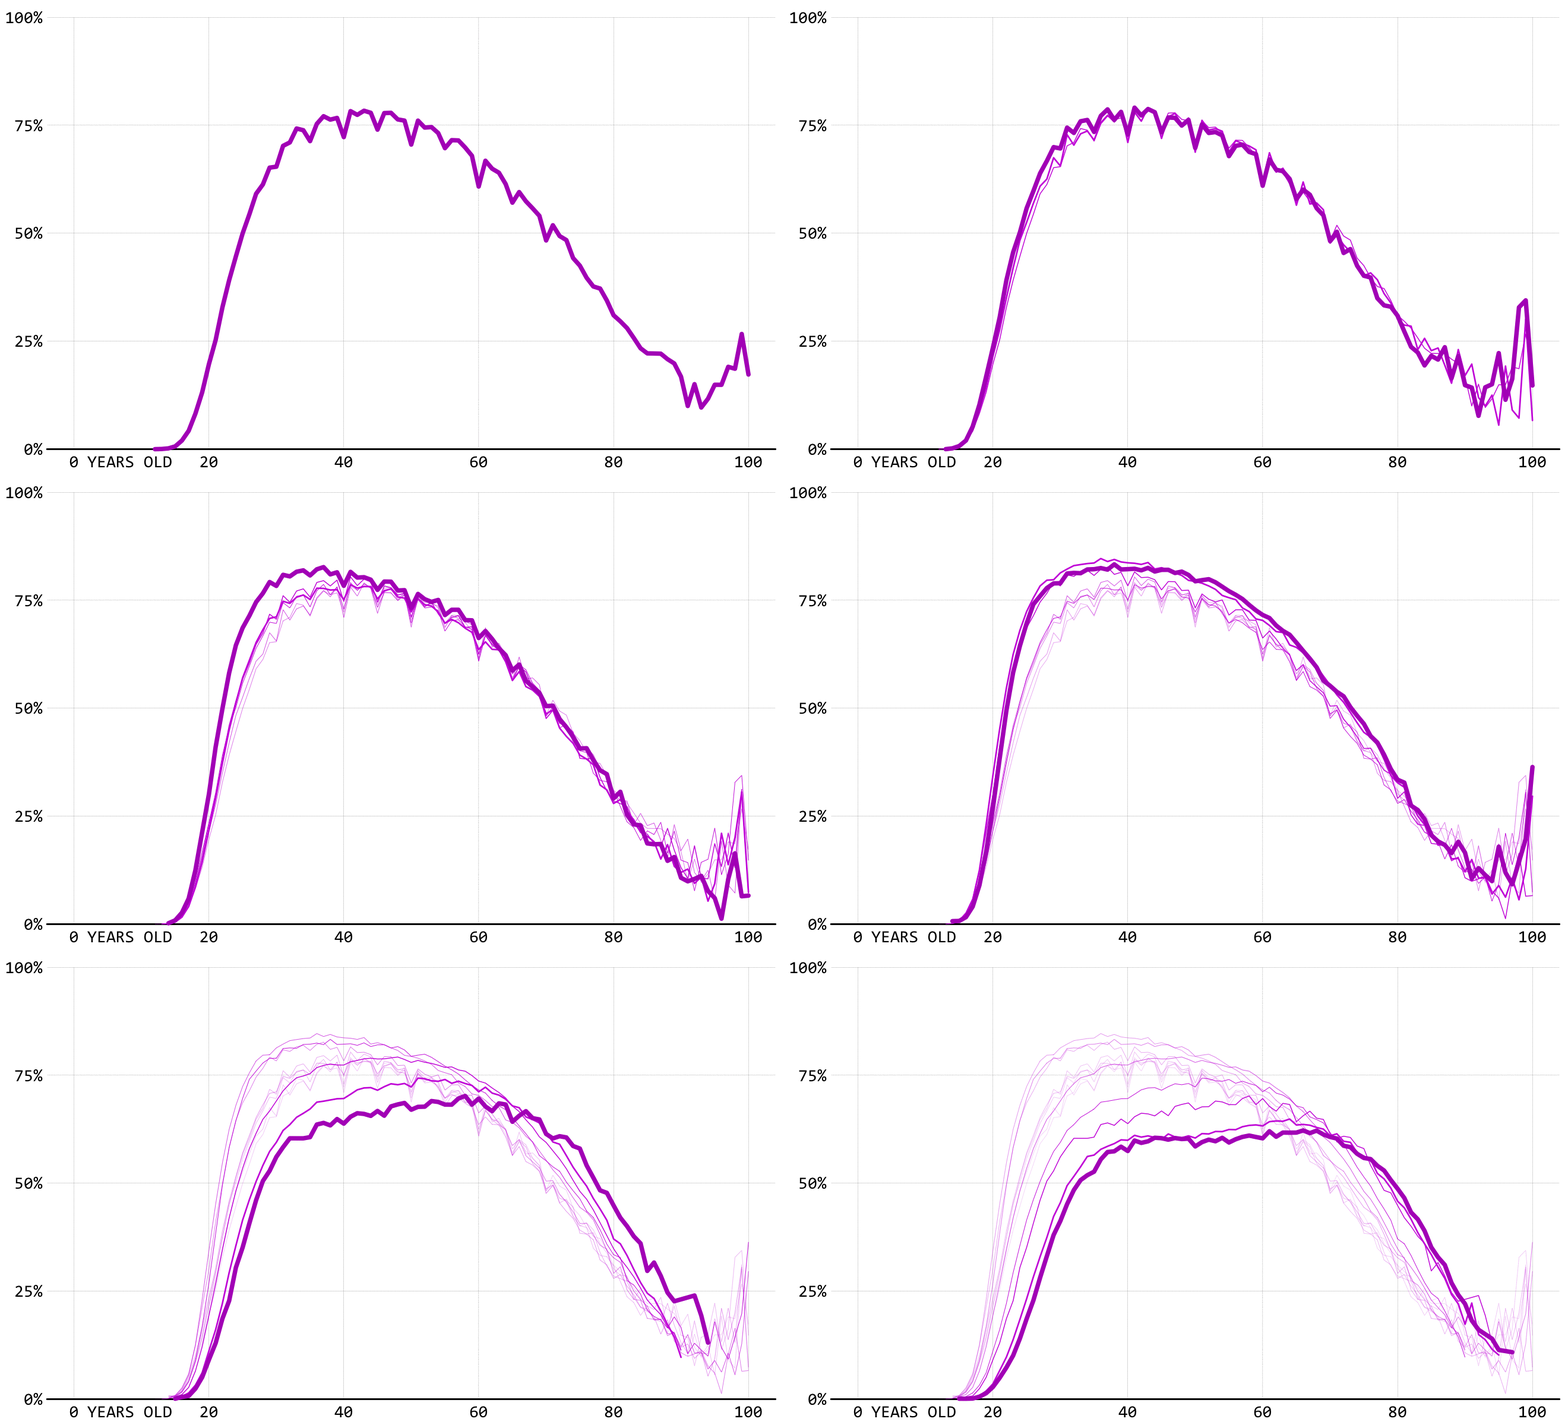
Marrying age is kind of the inverse of the never married chart. The lines shift down and to the right, representing people marrying at an older age. Divorce rate also probably factors in here, decreasing the percentage of people who are married at any given age.
Widowed
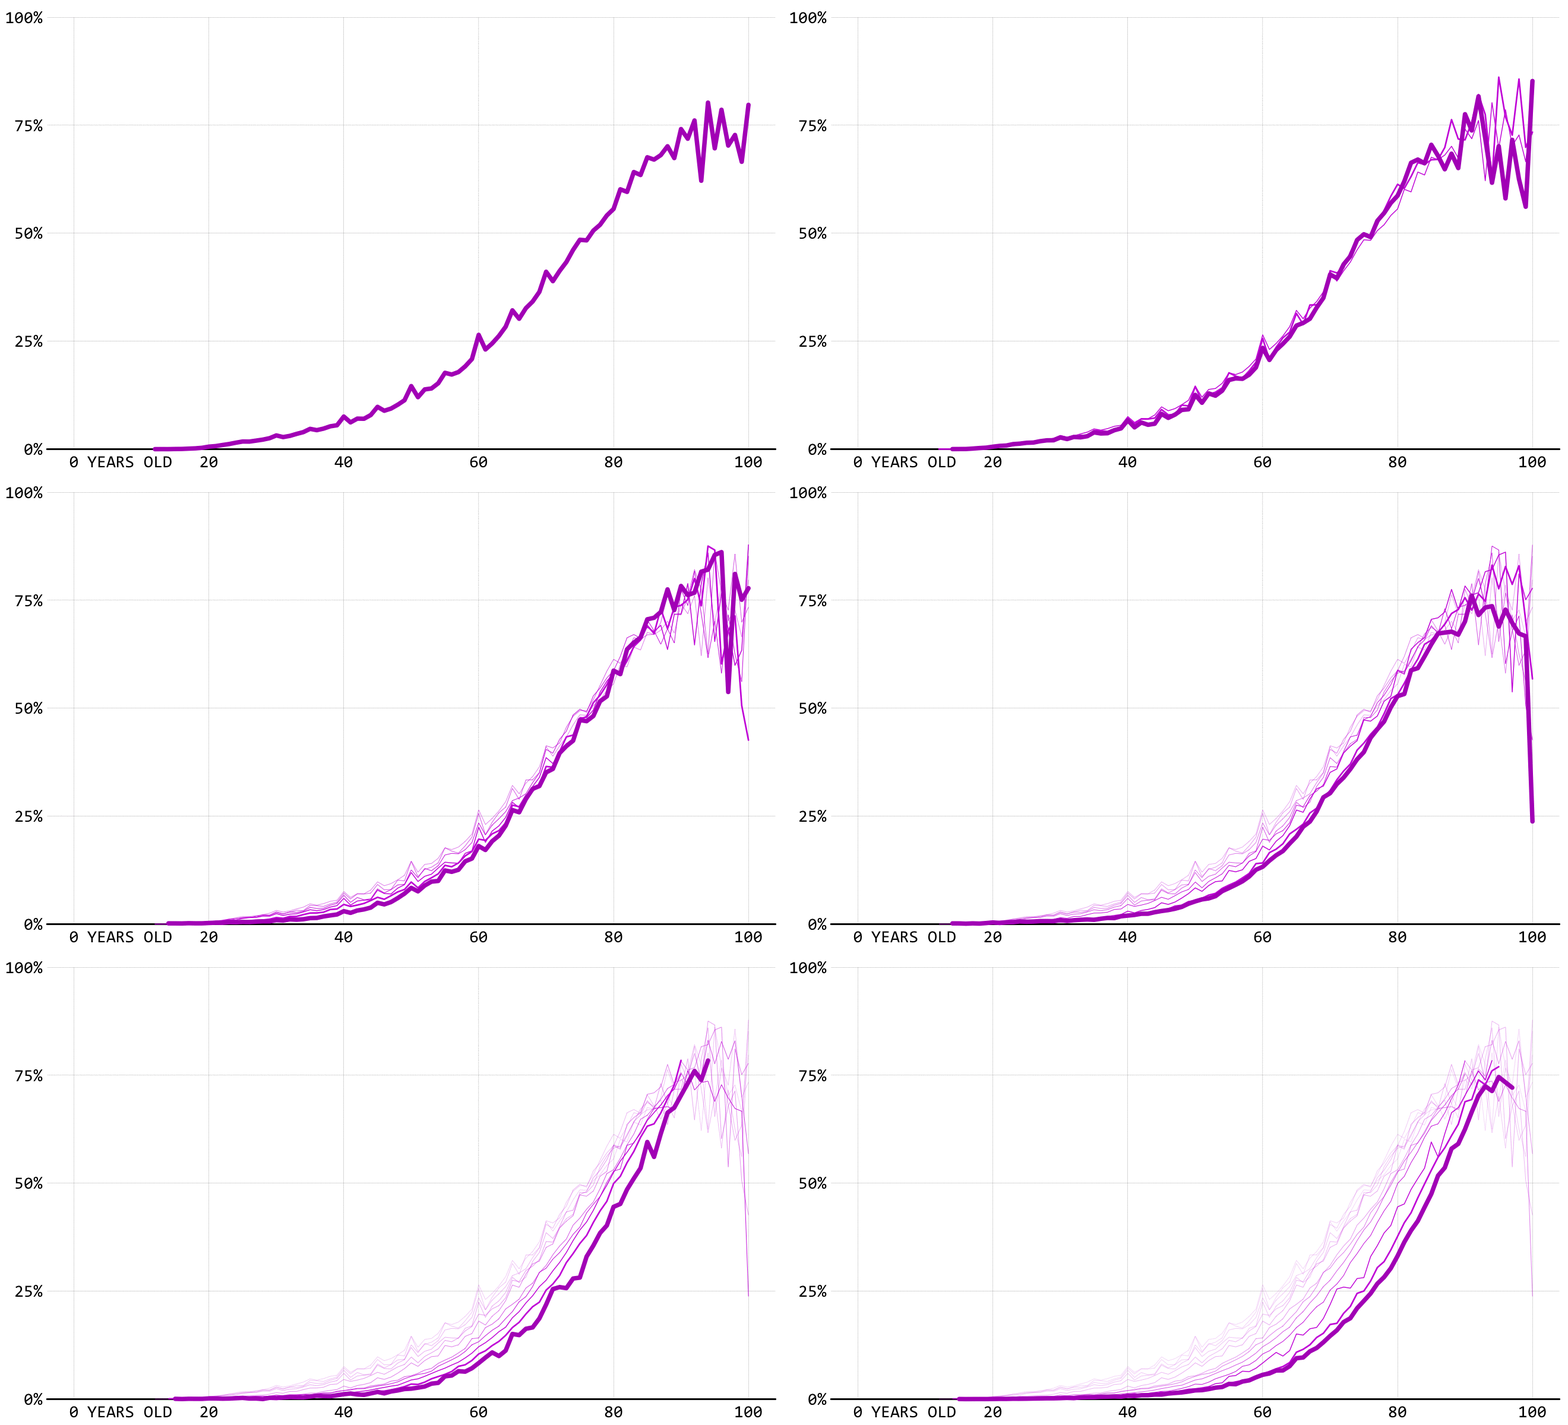
The widowed line also sees a shift towards older ages, likely directly linked to life expectancy. People live longer now, so as one would expect, spouses pass later.
Divorced
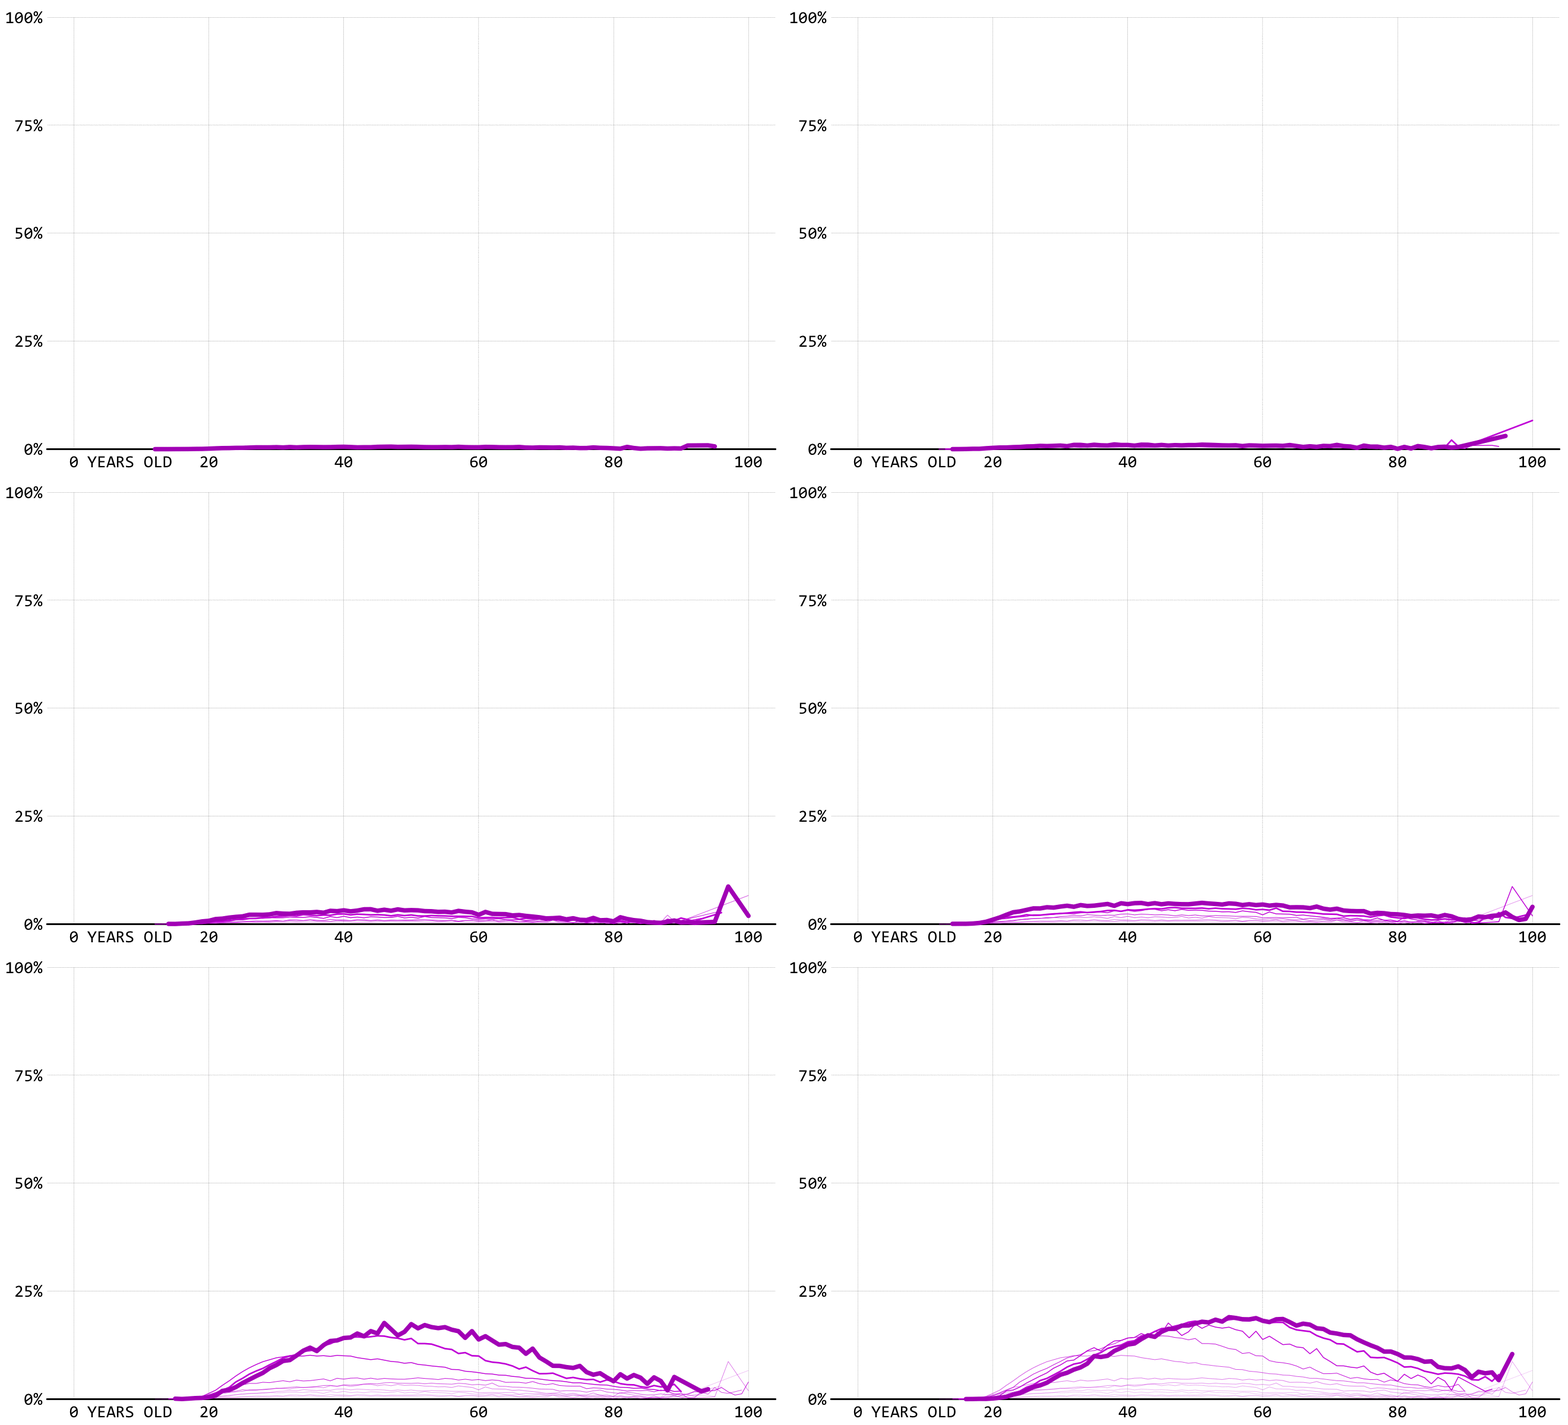
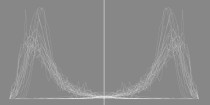
What was almost non-existent a century ago is now increasingly common. The lines look like a hill slowly growing wider and taller, which probably takes a chunk out of the married mountain.
 Marrying Age
Here’s when different groups get married these days.
 How to Make Animated Line Charts in R
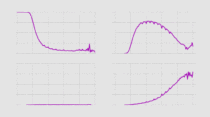
Here’s how to make this sort of chart using your own data.
Notes
- The data comes from decennial census from 1900 through 1990. Then the data comes from the American Community Survey in 2000, 2010, and 2015. I downloaded the data using the IPUMS extraction tool.
- I prepared the data and made the charts in R.
Chart Type Used

Become a member. Support an independent site. Get extra visualization goodness.
See What You Get