Commonness of Divorce in America
I wondered how common it is for someone to get a divorce. While I’ve touched on the topic before, I’ve never calculated it directly, so I gave it a go.
I looked at five years of American Community Survey data from 2016 to 2020. If married before, participants were asked the year of their most recent marriage. Even though I was curious about divorce, for some reason my first thought was to calculate the percentage of people who were still married, given the year they married.
Still Married
The more recent someone married, the higher the likelihood they’re still married — as expected — which only gives us a glimpse of divorce rates.
STILL MARRIED, OUT OF PEOPLE WHO MARRIED
100%
As expected, people who married more recently are more likely to still be married.
Some of these people were married more than once, but in their most recent marriages, about 70% were still married.
80%
60%
No longer married does not automatically mean divorce. It can also mean widowed, which is likely for longer marriages.
40%
20%
0%
1942
1960
1980
2000
2020
YEAR OF MARRIAGE
SOURCE: American Community Survey, 2016-2020
STILL MARRIED, OUT OF PEOPLE WHO MARRIED
100%
As expected, people who married more recently are more likely to still be married.
No longer married does not mean divorce. It can also mean widowed, which is likely for longer marriages.
80%
60%
40%
20%
0%
1942
1960
1980
2000
2020
YEAR OF MARRIAGE
SOURCE: American Community Survey, 2016-2020
Those who are not still married doesn’t mean they’re divorced though. They might be widowed or just separated. The ACS provides five statuses for those who have been married: married with spouse present, married with spouse absent, separated, divorced, and widowed. Here’s the distribution of those statuses, again by year of marriage.
Marital Status
It helps to see marital statuses by year of marriage, as divorce is only one part of a distribution. For earlier marriages, it’s much more common to be widowed and divorced, which makes sense when you consider life expectancy.
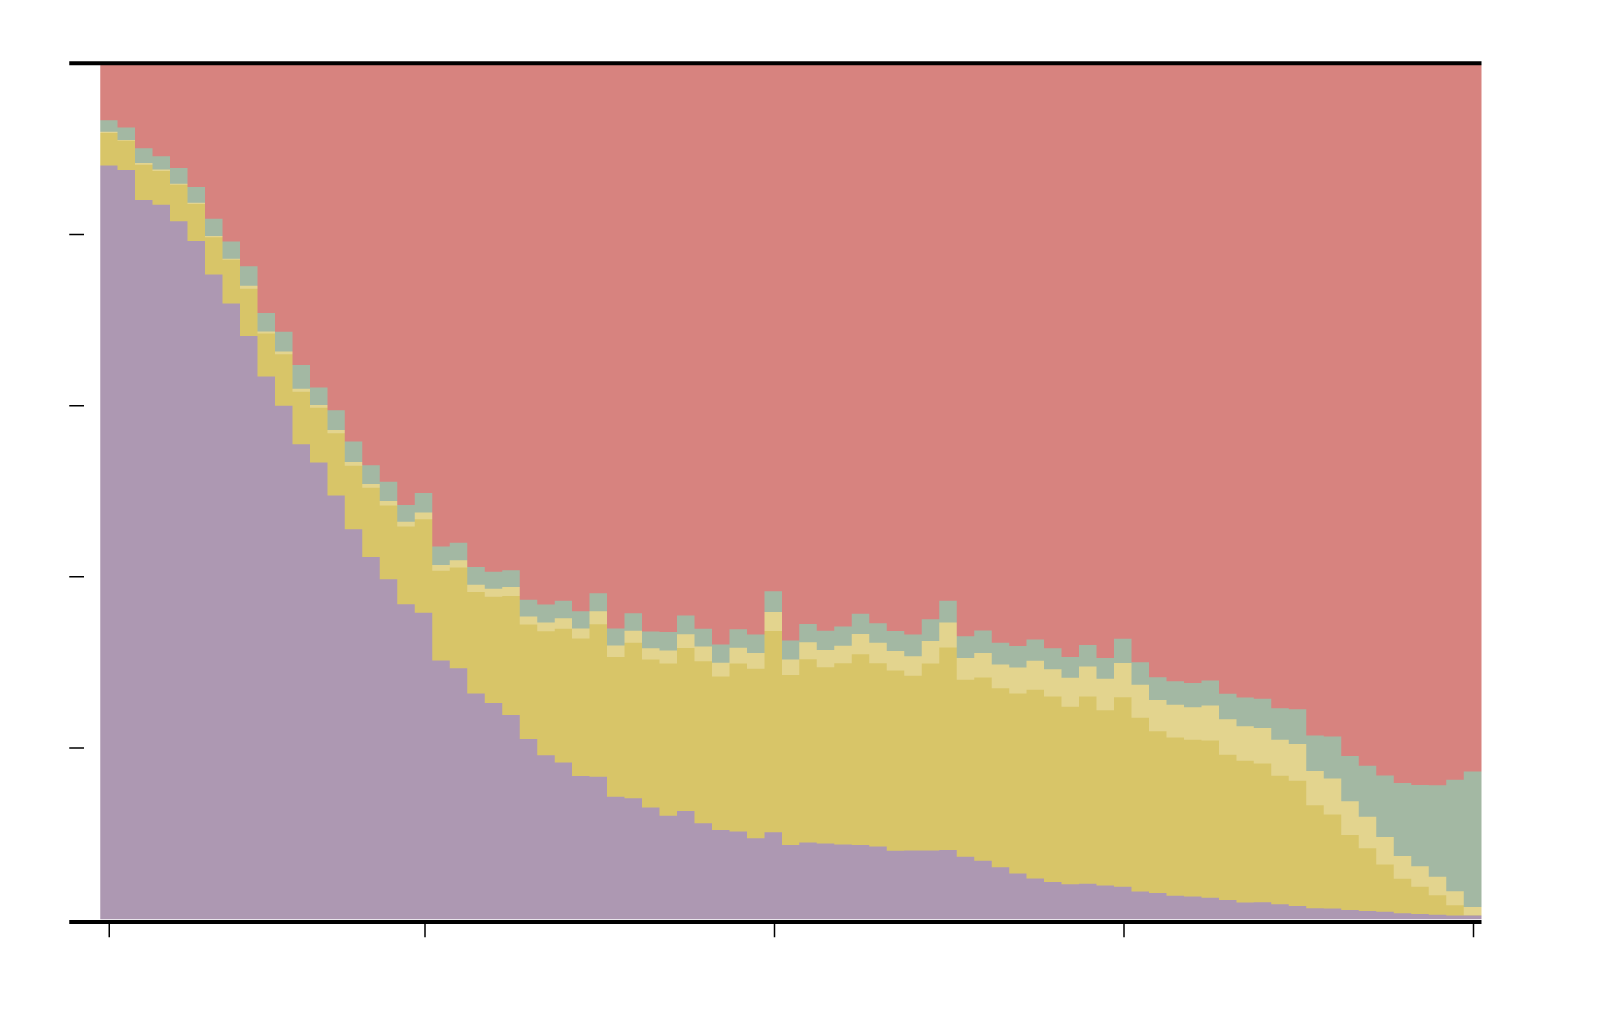
MARITAL STATUS, OUT OF PEOPLE WHO MARRIED
100%
80%
Married, Spouse Present
60%
40%
Widowed
Separated
20%
Divorced
Married, Spouse Absent
0%
1942
1960
1980
2000
2020
YEAR OF MARRIAGE
SOURCE: American Community Survey, 2016-2020

MARITAL STATUS, OF PEOPLE WHO MARRIED
100%
80%
Married,
Spouse Present
60%
40%
Married, Spouse Absent
Separated
20%
Divorced
Widowed
0%
1942
1960
1980
2000
2020
YEAR OF MARRIAGE
SOURCE: American Community Survey, 2016-2020
While interesting, it still didn’t answer the original question of how common divorce is. Going by year of marriage was only partially useful, because it only covered the most recent marriage. People who were married at the time of the survey but divorced previously weren’t counted.
So I counted people who were either divorced or married more than one time and divided by the number of people who married at least once. Then I charted by age.
Divorce Rate by Age
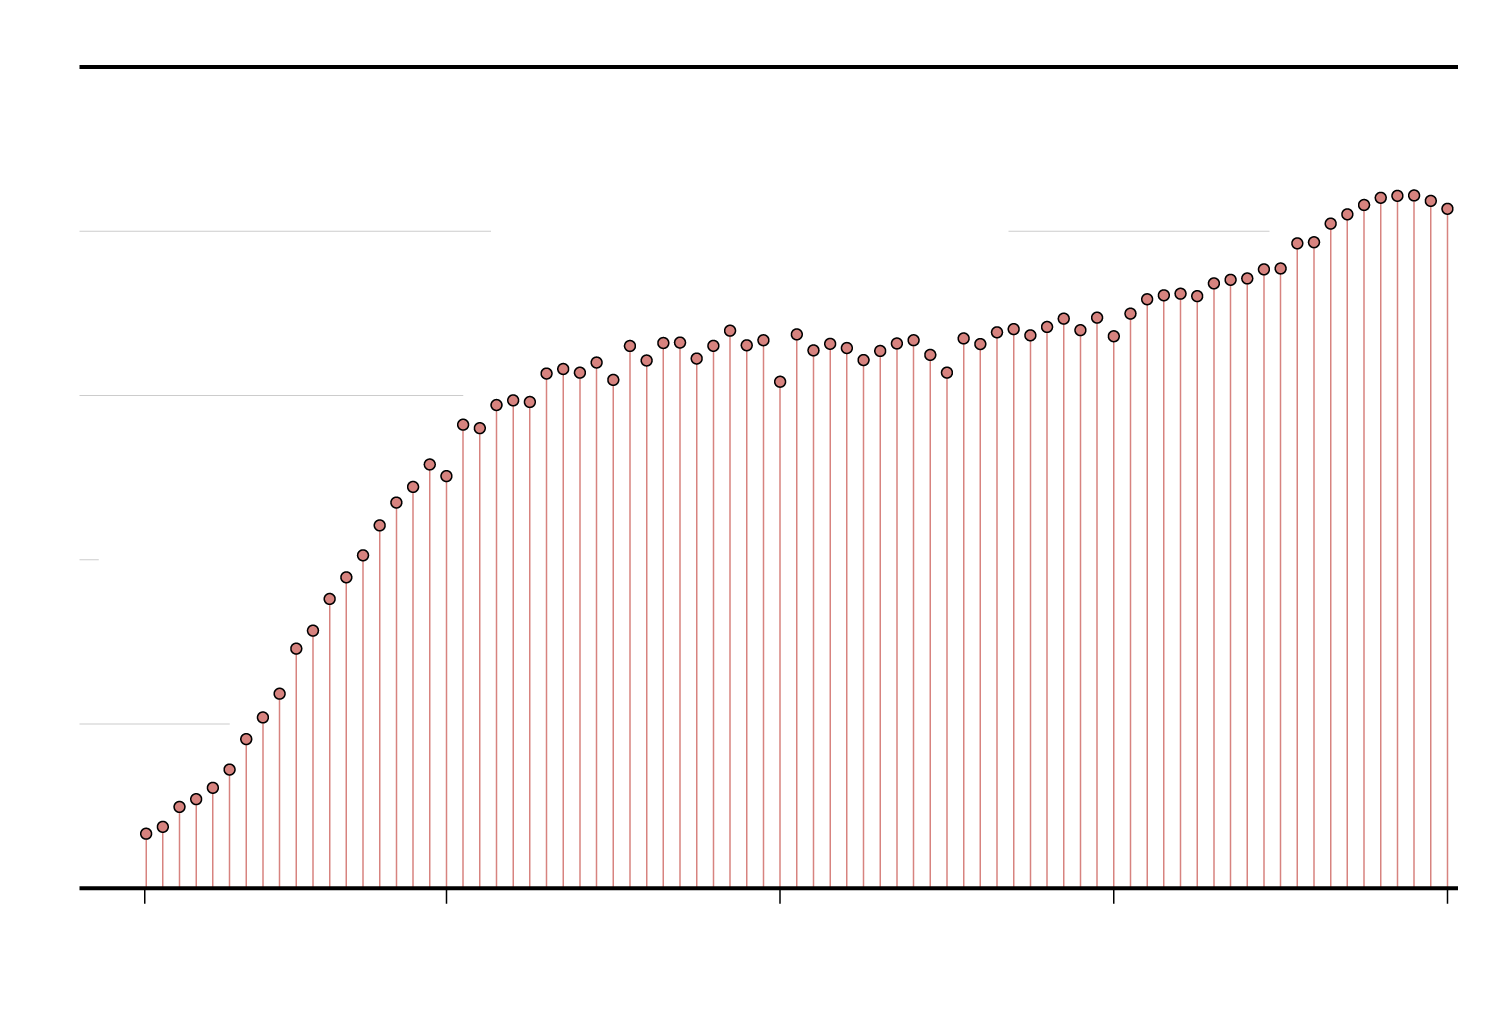
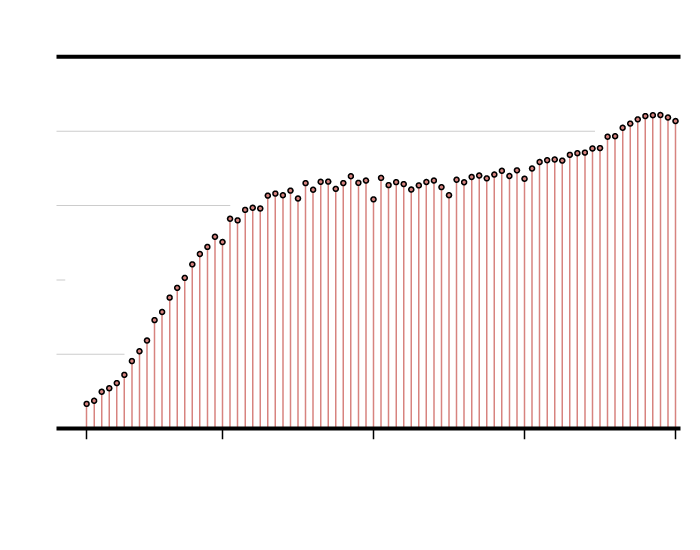
Maybe it is more useful to look at divorce by age instead of of year of marriage.
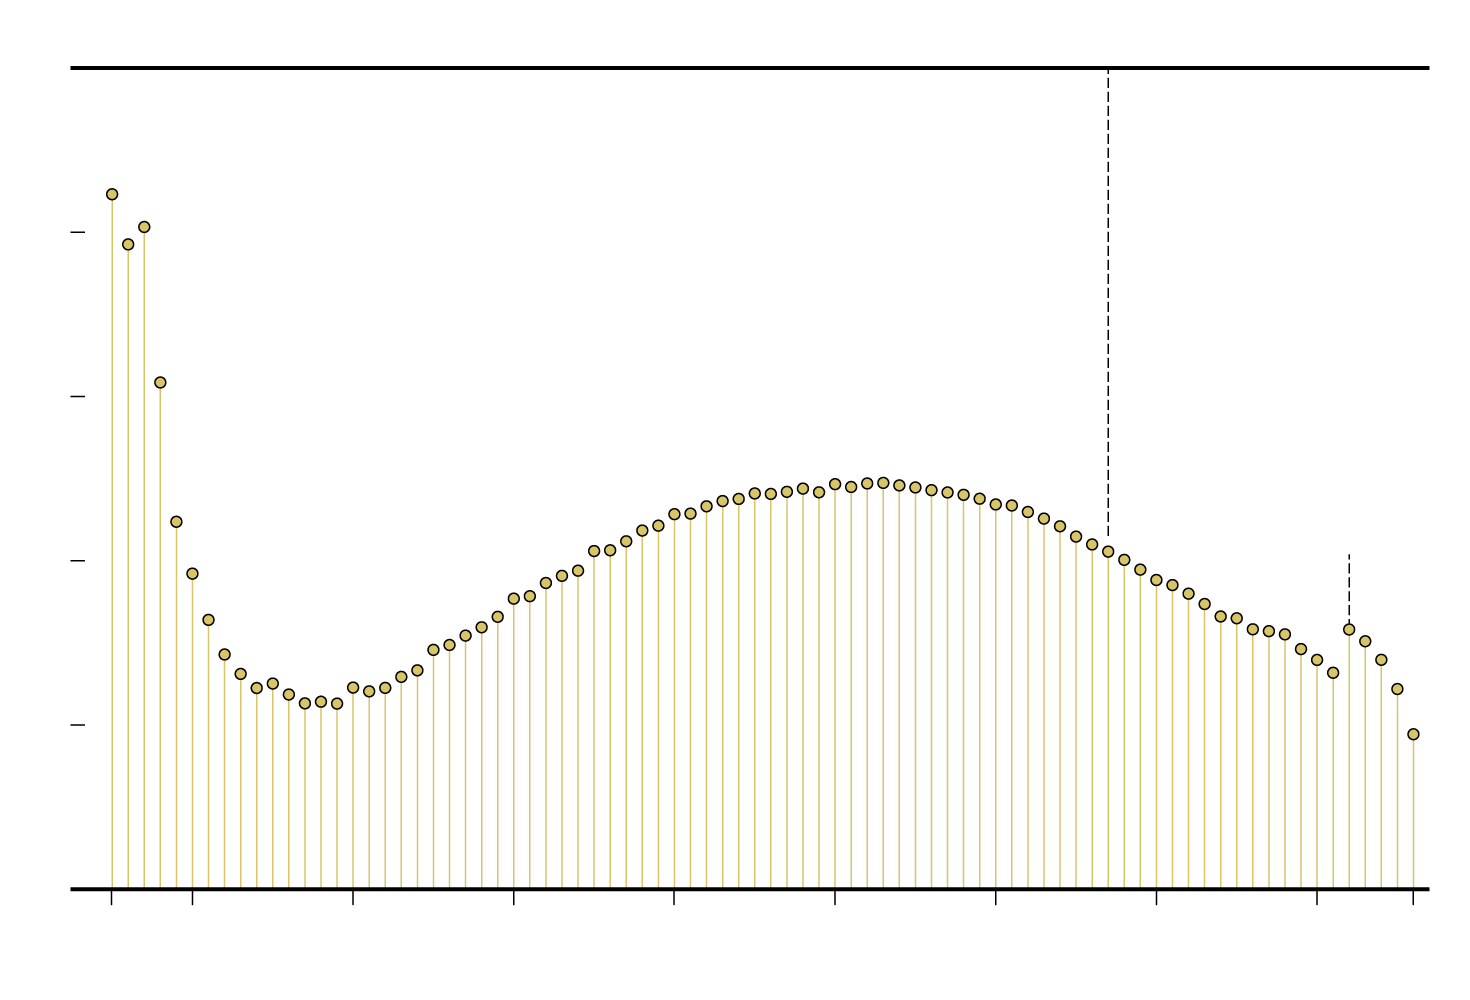
DIVORCED OR MARRIED MORE THAN ONCE, OUT OF PEOPLE WHO MARRIED
100%
U.S. LIFE EXPECTANCY
Those who marry at a young age are likely to divorce.
80%
Eventually, mortality becomes more common than marriage and divorce.
60%
Pretty sure this bump is a sampling artifact, but I suspect the downward trend is real.
40%
20%
0%
15
20
30
40
50
60
70
80
90
96
YEARS OLD
SOURCE: American Community Survey, 2016-2020
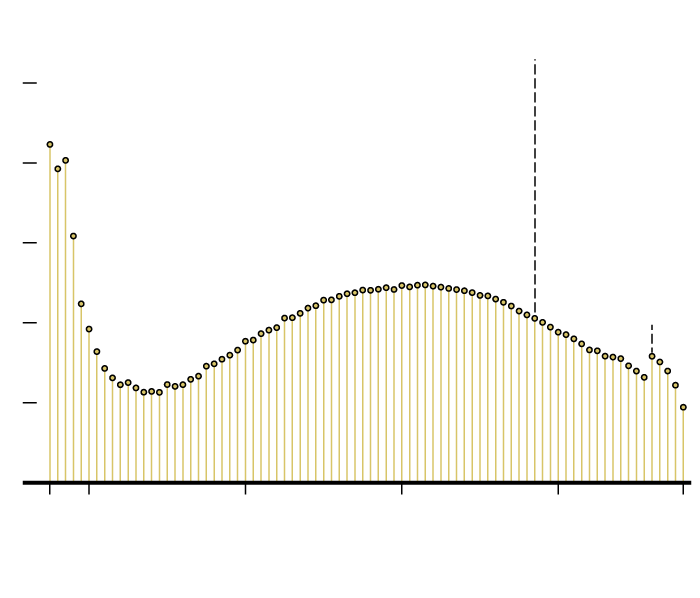
DIVORCED OR MARRIED MORE THAN ONCE, OF THOSE WHO MARRIED
Those who marry at a young age are likely to divorce.
U.S. LIFE EXPECTANCY
100%
Pretty sure this bump is a sampling artifact, but I suspect the downward trend is real.
80%
Eventually, mortality becomes more common than marriage and divorce.
60%
40%
20%
0%
15
20
40
60
80
96
YEARS OLD
SOURCE: American Community Survey, 2016-2020
Out of people who married at least once, the percentage of people who were married more than once or divorced approaches 50 percent as you get to age 60. But mortality appears to take precedence after that.
I was kind of surprised by how volatile the teenage marriages seem to be, and I thought the rate for 20s and 30s would be lower than came out. Then again, we’re only looking at the people who were married. There’s a lot of people who have never married at that age and people are marrying later. So maybe not so surprising.
In any case, divorce I guess is pretty common no matter what angle you look from.
Notes
The estimates are based on 2016-2020 American Community Survey microdata, which I downloaded from IPUMS. I analyzed, compiled, and visualized the data with R.
Chart Types Used


Become a member. Support an independent site. Get extra visualization goodness.
See What You Get