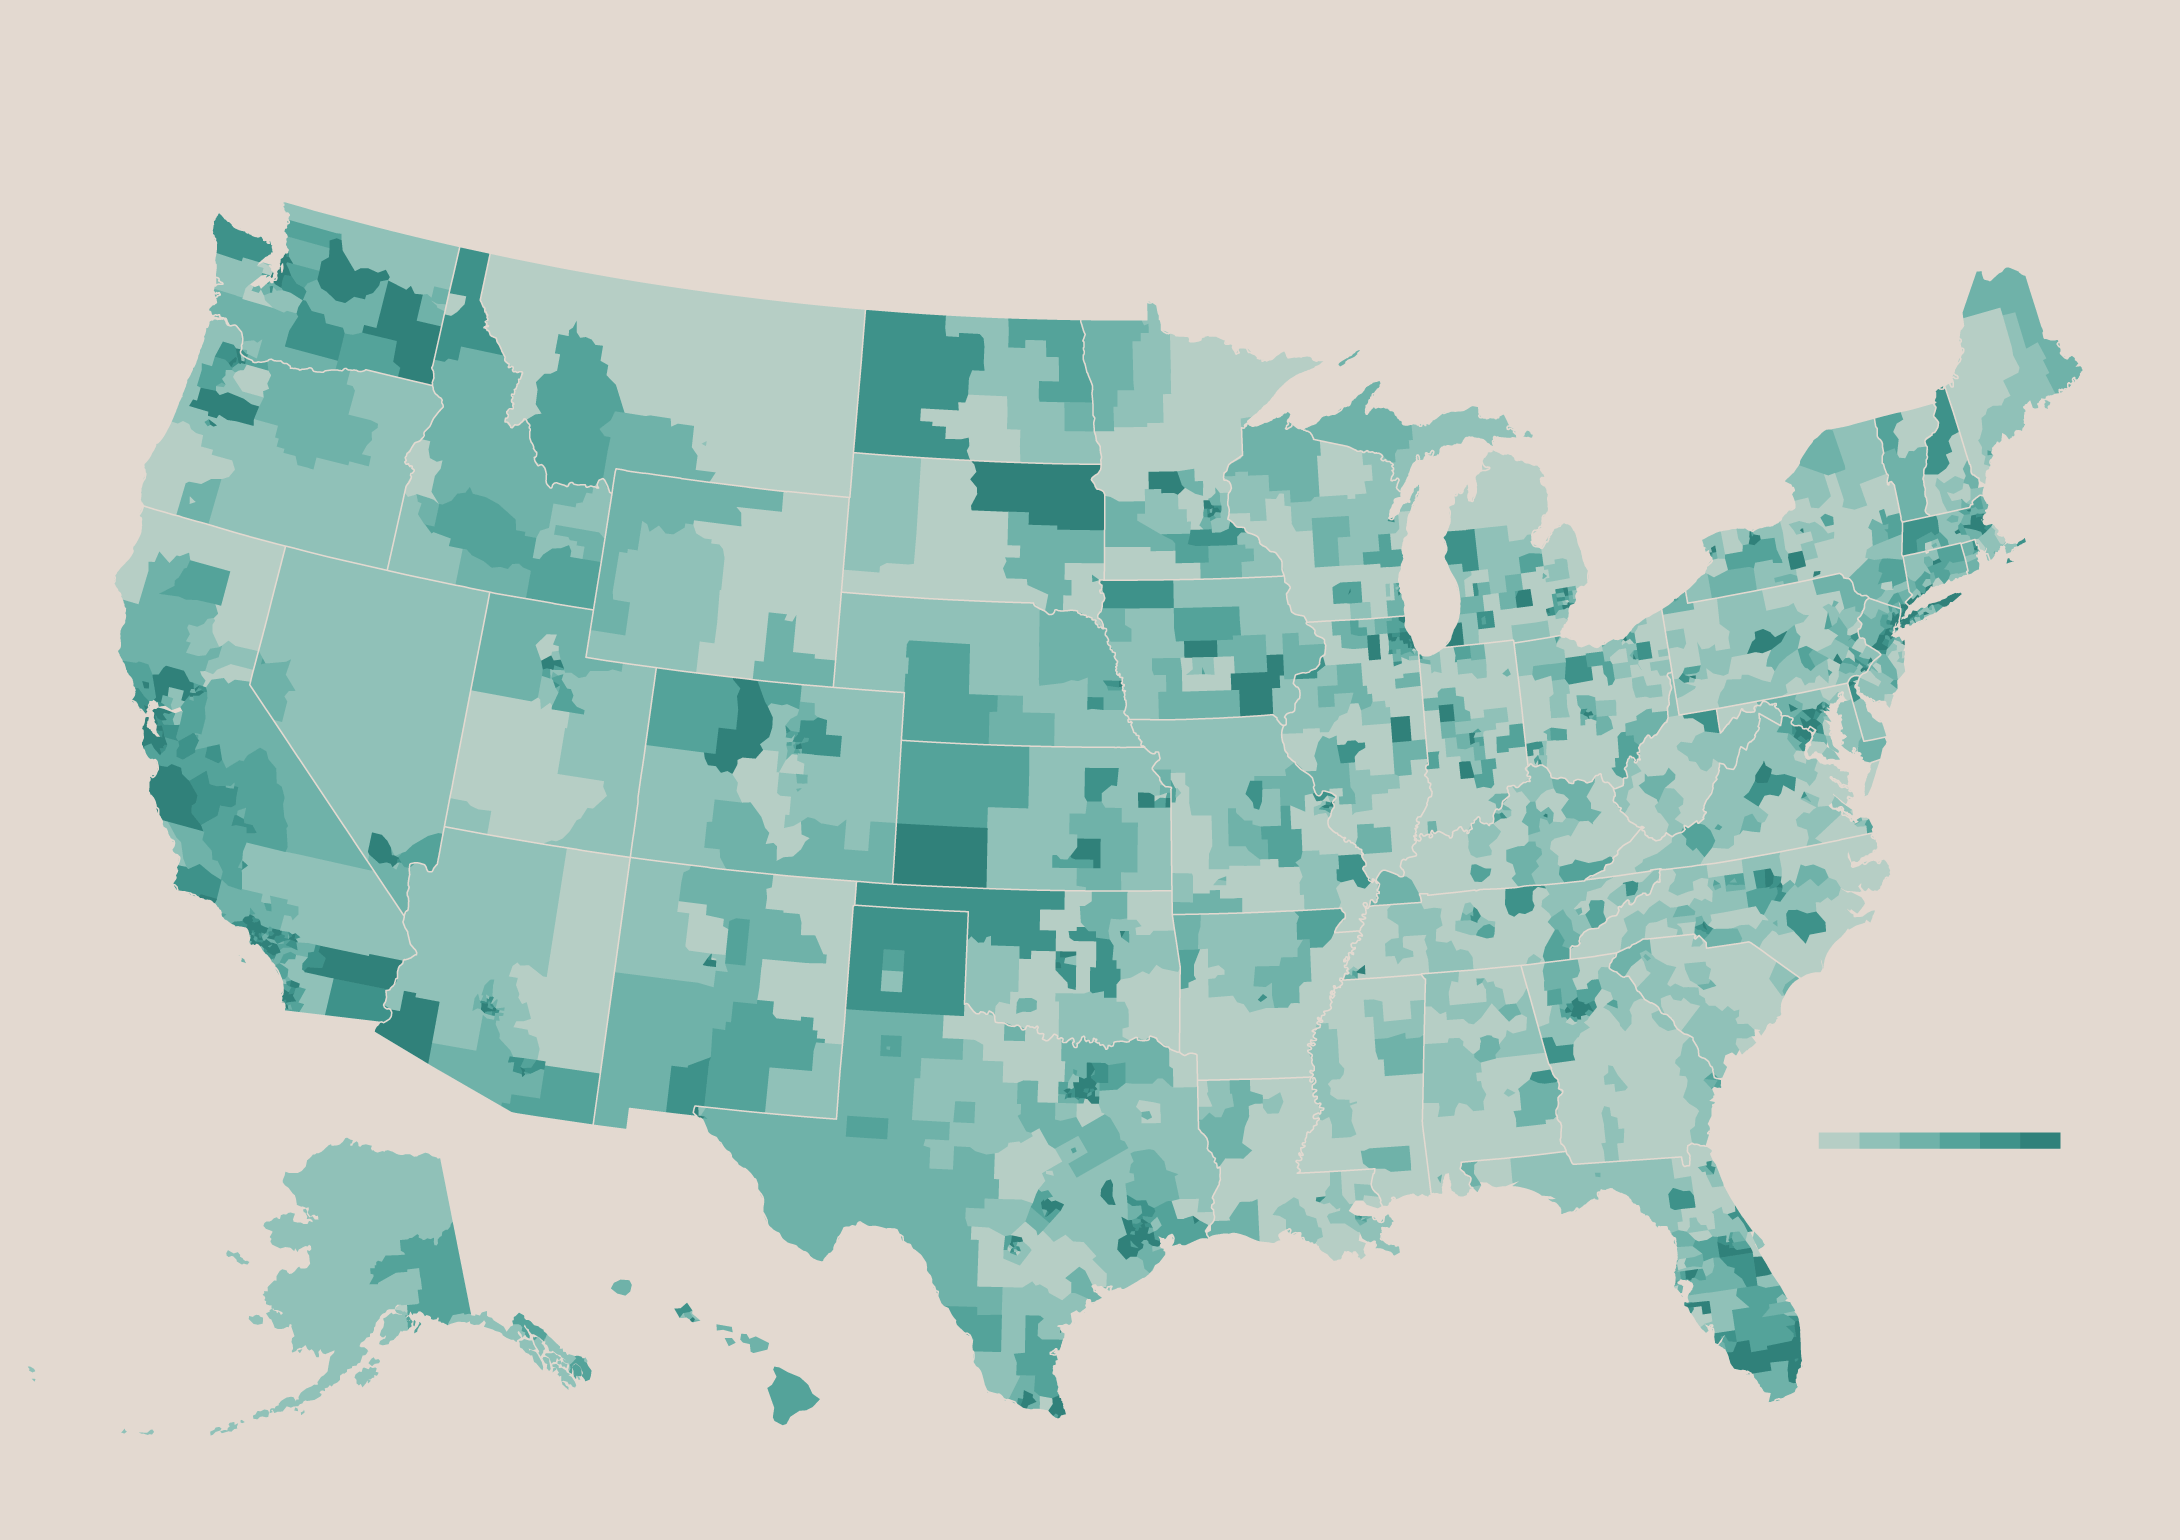
Map of Foreign Students
There are over 1 million international higher-education students enrolled in the United States. The map below shows where they reside.
PERCENTAGE OF
FOREIGN STUDENTS IN HIGHER EDUCATION
OUT OF STUDENT POPULATION
Compiled from estimates from the 5-year 2018 American Community Survey
PCT. STUDENTS WHO ARE NOT CITIZENS
2%
4%
6%
8%
10%
Map by FlowingData, https://flowingdata.com
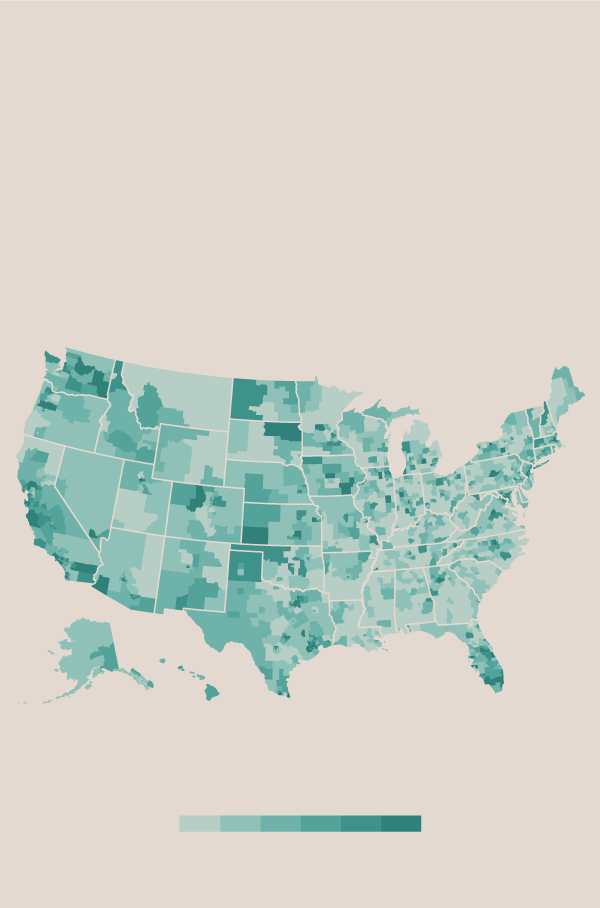
PERCENTAGE OF
FOREIGN STUDENTS IN HIGHER EDUCATION
OUT OF STUDENT POPULATION
Compiled from estimates from the 5-year 2018 American Community Survey
PCT. STUDENTS WHO ARE NOT CITIZENS
2%
6%
4%
8%
10%
The American Community Survey data was downloaded via IPUMS. Percentages were calculated by dividing the number of students who were not citizens by total number of students.
As you might expect, you see more foreign students along the coast and in major port cities.
Chart Type Used

Become a member. Support an independent site. Get extra visualization goodness.
See What You Get