Best Data Visualization Projects of 2021

Phew, just made it. These are my favorite data visualization projects from 2021.
You can see picks from previous years here: 2008, 2009, 2010, 2011, 2013, 2014, 2015, 2016, 2017, 2018, 2019, 2020.
Like last year, there were many Covid-related charts on the internets this year. While they are important to gauge the state of things, I found myself veering away from them to focus on other areas. I craved distraction, practical information for the times, and anything outside the bubble.
Best Atlas of Things That Are Difficult to See in Real Life
Atlas of the Invisible
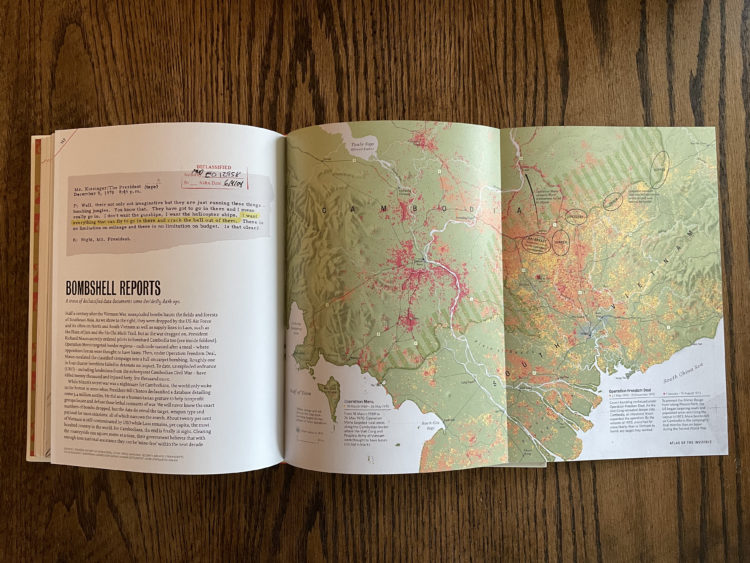
The book by James Cheshire and Oliver Uberti is a visual treat and was a welcome addition to the coffee table. [See the Project / On FlowingData]
Best Demonstration of a Big Ship Stuck in a Canal
Ever Given Ever Ywhere
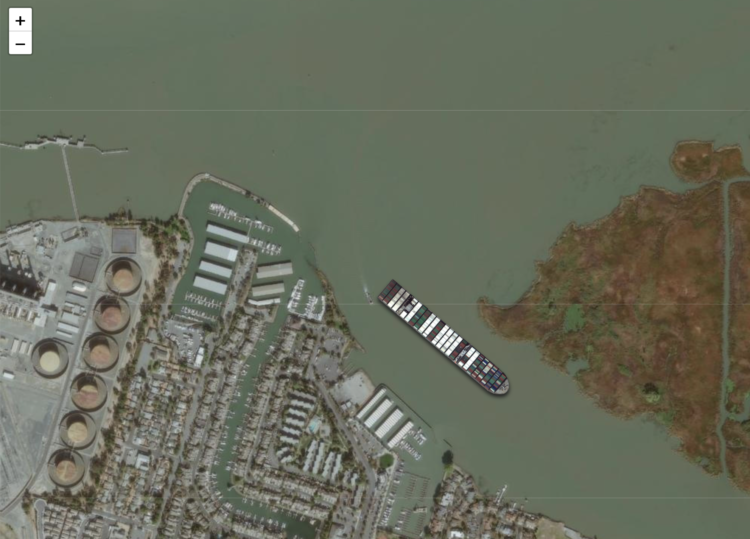
Remember when we got to collectively take a breath to check on the status of the Ever Given ship stuck in the Suez Canal? Garrett Dash Nelson made an interactive that let you put the Ever Given anywhere on the planet for scale. [See the Project / On FlowingData]
Runner-up — “Steer through the Suez Canal” by Sarah-Grace Mankarious, Marco Chacón for CNN [See the Project / On FlowingData]
Runner-up — Scale-a-Tron by Stamen [See the Project / On FlowingData]
Runner-up — “How the Ever Given was freed from the Suez Canal: A visual analysis” by Atthar Mirza, Júlia Ledur and Ruby Mellen for The Washington Post [See the Project / On FlowingData]
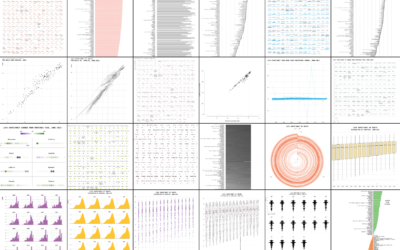
Best Overview of Visualization Research That Is Not Overly Pedantic
The Science of Visual Data Communication: What Works
Visualization research can be difficult to digest when you’re trying to apply it to everyday work. Oftentimes, it feels like the process and findings are too specific. Steven L. Franconeri, Lace M. Padilla, Priti Shah, Jeffrey M. Zacks, and Jessica Hullman made an effort to put pieces of the puzzle together. [See the Project / On FlowingData]
Runner-up — The alt.VIS workshop covered more unconventional topics. I read almost every paper, which never happens. [See the Project / On FlowingData]
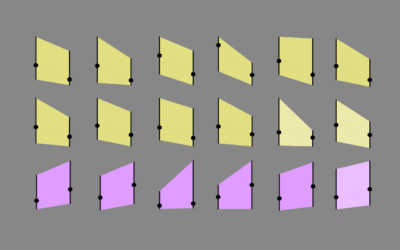
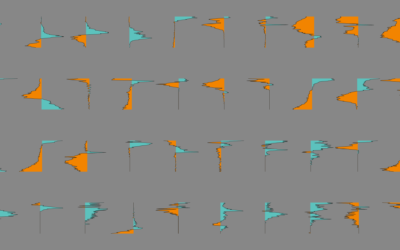
Best Fresh Visualization of Soccer Matches
UEFA 2020 chart gallery
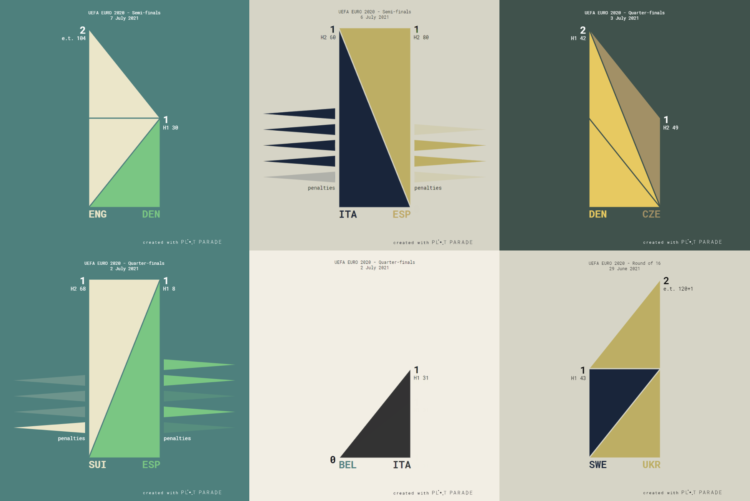
Krisztina Szűcs provides a new and useful way to see soccer match scores play out. That’s not an easy thing to do these days. You usually just get one or the other. [See the Project / On FlowingData]
Runner-up — “All the passes” by Karim Douïeb [See the Project / On FlowingData]
Best What-If Reopening Scenario
Why Opening Windows Is a Key to Reopening Schools

The kids went back to school this year, which was both exciting and nerve-racking. Leading up to the openings, The New York Times used air flow simulations to show why classrooms should open the windows. [See the Project / On FlowingData]
Runner-up — “What will it be like when we go back to the office?” by Sarah Slobin and Feilding Cage for Reuters [See the Project / On FlowingData]
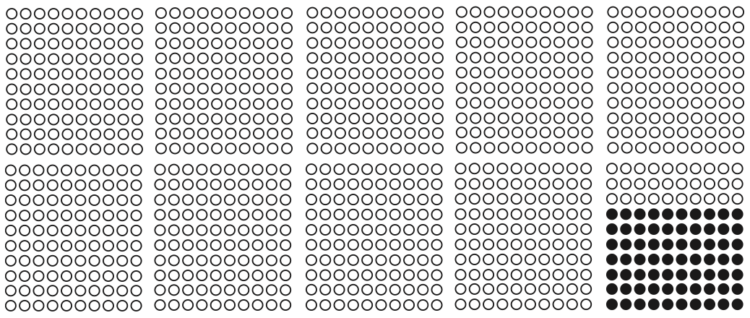
Best Use of Step-Wise Moving Bubbles
This Is How Everyday Sexism Could Stop You From Getting That Promotion

I am a sucker for moving bubbles. Jessica Nordell and Yaryna Serkez for NYT Opinion showed the bubbles move up the corporate ladder in uneven ways. [See the Project / On FlowingData]
Best Gratuitous Use of 3-D Modeling to Satisfy a Curiosity
The fry universe
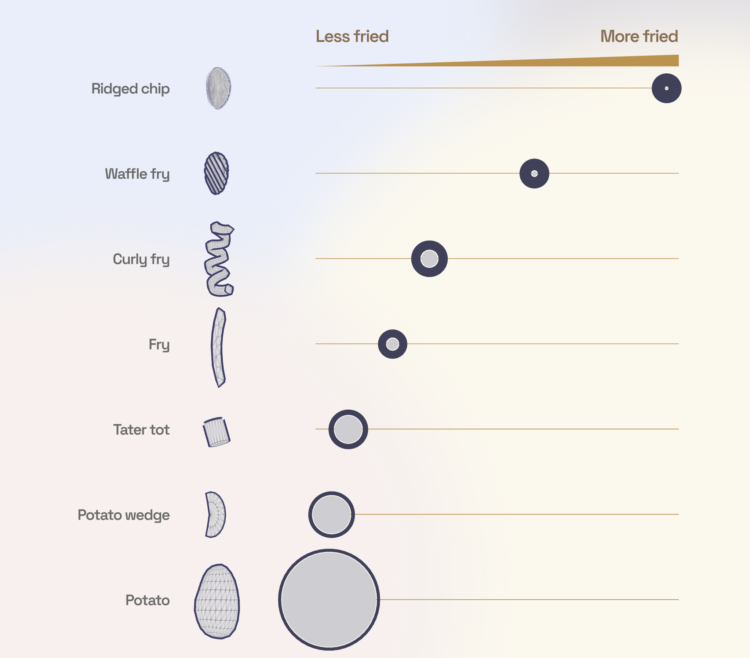
Chris Williams used 3-D modeling to calculate the ratio between crispy exterior and fluffy interior for various fried potato shapes. So important. [See the Project / On FlowingData]
Best Walk-Through Showing Scale of Unfamiliar Areas to Most
Africa’s Rising Cities
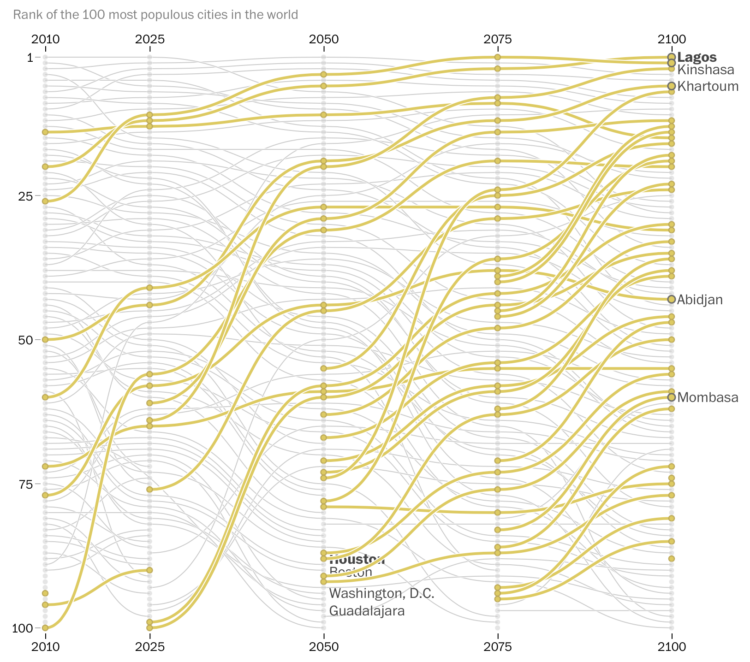
The Washington Post used a series of charts, maps, photographs, and video to show how fast African cities using American cities as a point of reference. [See the Project / On FlowingData]
Best Bat Illustrations with Traditional Charts
Bats and the Origin of Outbreaks
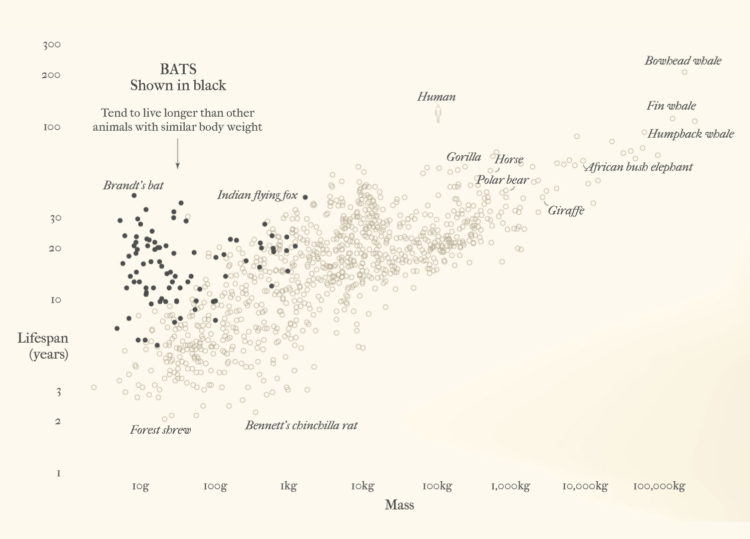
Julia Janicki and Simon Scarr, with illustrations by Catherine Tai for Reuters explained why bats make an ideal host for viruses. [See the Project / On FlowingData]
Best Way to See Where a Raindrop Ends Up
River Runner
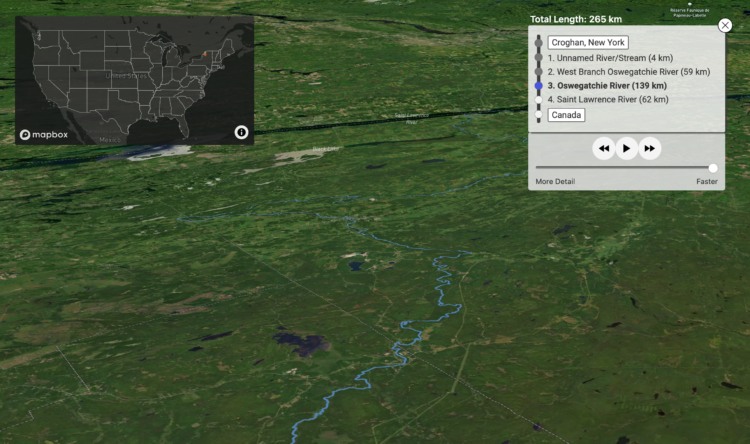
Sam Learner made this map that lets place a raindrop anywhere in the contiguous United States, and you’re taken down a path of rivers and streams to see where the raindrop ends up. [See the Project / On FlowingData]
Best Deep Dive Into How the Ultrawealthy Make and Spend Money
The Secret IRS Files
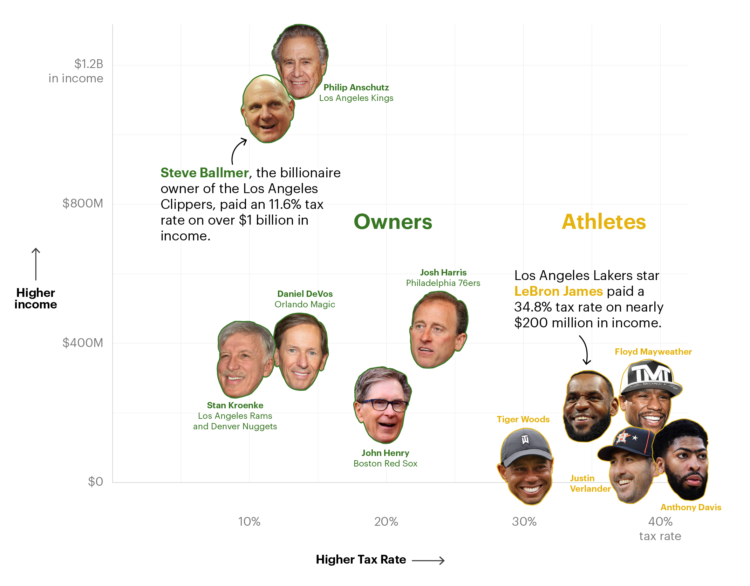
ProPublica got a hold of IRS files and did their best to frame billions of dollars into a relatable context. [See the Project / On FlowingData]
It was a weird year with many great data graphics. I’m looking forward to seeing what 2022 has for us. Hopefully less weird and sad, but still great data visualization.
Check out the best of the best from previous years: 2008, 2009, 2010, 2011, 2013, 2014, 2015, 2016, 2017, 2018, 2019, 2020. (I can’t remember why I skipped 2012.)
Become a member. Support an independent site. Get extra visualization goodness.
See What You Get