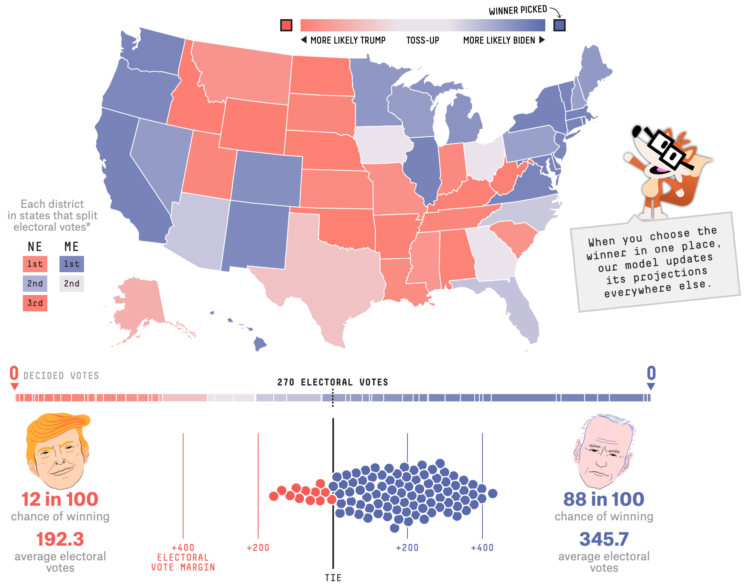
With each model update, FiveThirtyEight runs 40,000 simulations, or what-ifs, to calculate the odds for who will win the election. Their new interactive lets you experiment with all of the what-ifs to see how the odds shift when a candidate wins a state.
It answers the question, “If ______ wins in ______ and in ______, etc., what are the chances of him winning the whole thing?”
So if Trump wins a very red state or Biden wins a very blue state, the overall odds don’t change that much. But if a very red goes blue, or a very blue goes red, then the odds swing dramatically.
There’s a good lesson on conditional probability somewhere in there.


 Visualize This: The FlowingData Guide to Design, Visualization, and Statistics (2nd Edition)
