WNYC mapped all street stops that resulted in the recovery of a gun,…
2012
-
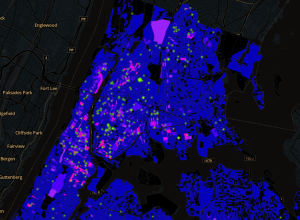
Stop-and-frisk hotspots mapped →
-
Link
Data Display vs. Data Visualization →
Or telling vs. exploring
-
Link
The Stupidity of Computers →
They only do what you tell them to do and nothing more i.e. no software is going to make you a data genius
-
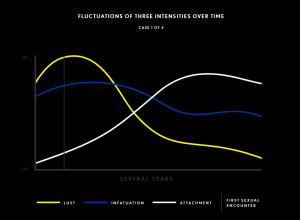
Charts describe love and relationships →
Love is complicated. It twists, it turns, and sometimes it smacks you in…
-
Link
Twitter data scientist →
Interview with Edwin Chen, whose job it is to make sense of tweets
-
Link
Time in Perspective →
Interesting view that transitions from past to present, weekly to hourly [via]
-
Browse the web of Wikipedia with Wikiweb iPad app
While we’re on the subject of the web that is Wikipedia, four-man, Baltimore-based…
-
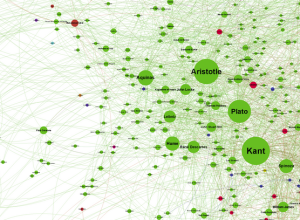
Graphing every idea in history →
Brendan Griffen created a giant network of people, using every profile on Wikipedia…
-
Link
Feltronifier →
Lets you make a map similar to in the annual reports
-
Link
Dealing with data →
Towards reproducibility in research
-
Link
Amanda Cox wins ASA Excellence Award →
Well-deserved. Also see her talk at EyeO this year
-
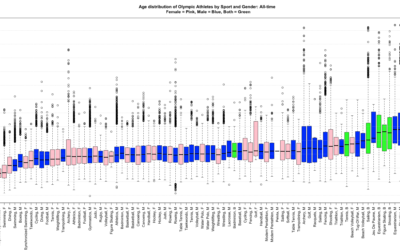
Olympian age distributions compared →
Last week, the Washington Post compared the ages of Olympians, but it only…
-
Link
How economists get tripped up by statistics →
“the more academic papers that economists read, the more misguided they’ll become”
-
Link
Underscore.Nest →
Convert flat data into nested tree structures
-
Data plural versus data singular
Kevin Drum on data is or data are:
Now, I know that lots… -
The future of maps isn’t maps →
Rebecca Rosen for The Atlantic on why maps aren’t the best interface all…
-
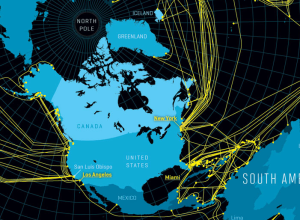
Map of the underwater Internet →
Nicolas Rapp, for Fortune Magazine, mapped the underwater cables that make the global…
-
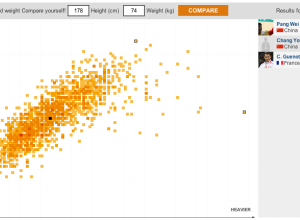
Where you measure up against Olympians →
I think the theme of this year’s Olympic graphics is how you relate…
-
Link
A Criticism of Visualization Criticism Criticism →
Robert Kosara’s response to this
-
Link
Data Quotes →
Some fun ones
Recently for Members
Second Edition
 Visualize This: The FlowingData Guide to Design, Visualization, and Statistics (2nd Edition)
 Visualize This: The FlowingData Guide to Design, Visualization, and Statistics (2nd Edition)
New tools, refined process.
Browse by Chart Type See All →


