The U.S. Census director John H. Thompson resigned and will leave June 30.…
News
Conferences, workshops, contests, and the like.
-
Census director resigns
-
Participate in the Data Visualization Community Survey
Elijah Meeks is running a detailed survey about data visualization people to gain…
-
Evolving graphics department at the New York Times
Ken Doctor for Nieman Lab had a chat with Steve Duenes from the…
-
Amanda Cox is new editor of The Upshot
So great and well-deserved.
-
R Consortium for further development of community
The Linux Foundation announced the R Consortium to provide support to the R…
-

Dick pics, privacy, and the NSA
Did you watch the latest Last Week Tonight with John Oliver yet? You…
-
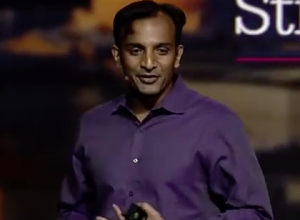
White House appoints first US Chief Data Scientist
Did you hear the news? The White House officially appointed DJ Patil as…
-

The Upshot, a data-centric site from The New York Times launched
We heard a little bit about The Upshot last month. Now we get…
-
The New York Times announced their data-driven news site, The Upshot
John McDuling for Quartz writes about the FiveThirtyEight replacement.
David Leonhardt, the Times’… -
Future of Statistics livestream
The Simply Statistics unconference just started a few minutes ago. Tune in live…
-

Other than advertisers
The Onion tackles data privacy:
“As a law-abiding resident of this nation, I… -
Nothing to hide
With all the stuff going on with surveillance and data privacy — especially…
-
Link
Most creative
Nate Silver topped Fast Company’s list of 100 most creative people in business.
-
Link
Data Crunchers Now the Cool Kids on Campus
Data Crunchers Now the Cool Kids on Campus. Well, about as cool as someone who calls his or herself a data cruncher, anyways.
-
Link
Magic Grants from Brown Institute for Media Innovation
The Brown Institute for Media Innovation has a call for magic grants for “a small team of graduate students or postgraduates who are expected to demonstrate the relevance and viability of their ideas by implementing a prototype or creating an innovative media product.” The Columbia branch is led by my adviser. Proposal submission deadline is May 3.
-
Link
Jeffrey Hammerbacher, Chief Scientist at Cloudera
Jeffrey Hammerbacher, Chief Scientist at Cloudera talks about big data in Charlie Rose interview.
-
Link
Data Scientist opening at NYT
There’s a data scientist opening at The New York Times, probably to fill the gap left by DataKind founder Jake Porway. [via]
-
Link
Watching Drones Drop
Pitch Interactive’s drone visualization spread across the Web yesterday. Wes Grubbs, the founder of the group, talked about the data on HuffPost Live.
-
Link
The Art of Data-based Visual Narratives
Nicholas Felton, who you probably know from his annual reports, is giving a two-day workshop on May 27 to 28 in Berlin on designing data-based visual narratives. It’s limited to 20 participants, so it’ll probably be an up close and personal experience.
-
Link
Tech data journalism bootcamp →
A thorough recap of the event
Recently for Members
Second Edition
 Visualize This: The FlowingData Guide to Design, Visualization, and Statistics (2nd Edition)
 Visualize This: The FlowingData Guide to Design, Visualization, and Statistics (2nd Edition)
New tools, refined process.
Browse by Chart Type See All →


