Along the same lines of Dolores Labs’ color experiment, Randall Munroe of xkcd…
2010 May
-
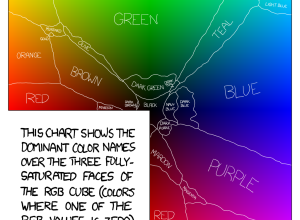
How men and women label colors
-
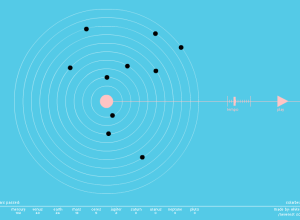
Planets make sweet music together
SolarBeat is an audiolization by Whitevinyl that makes music with the planets. Each…
-

The (nerdy) data-driven life
Gary Wolf, of Wired and The Quantified Self, describes personal data collection and…
-
Design for America deadline approaching
Just a quick note. Sunlight Labs’ Design for America contest is coming up…
-
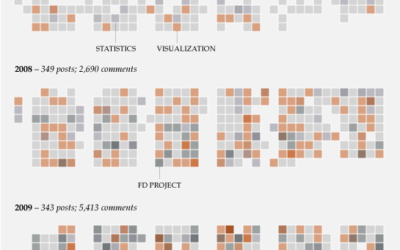
Data Underload: One Thousand Posts
On June 25, 2007 I published the first FlowingData post. Today, here is…
-
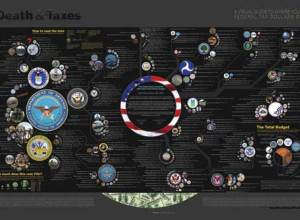
Weekend Fodder – Death and Taxes
Death and Taxes: 2011 poster – Jess’ annual look at government spending has…
-
Find out whose Twitter fans are dumber
Stupid Fight compares fans on Twitter using “stupid indicators” like “OMG” and number…
Recently for Members
Second Edition
 Visualize This: The FlowingData Guide to Design, Visualization, and Statistics (2nd Edition)
 Visualize This: The FlowingData Guide to Design, Visualization, and Statistics (2nd Edition)
New tools, refined process.
Browse by Chart Type See All →


