I call myself a statistician, because, well, I’m a statistics graduate student. However, the most important things I’ve learned are less formal, but have proven extremely useful when working/playing with data.
2010 March
-

Think Like a Statistician – Without the Math
-
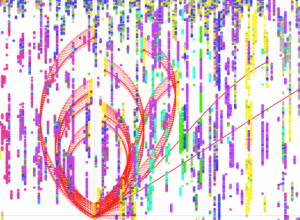
Visualize your Last.fm listening patterns with LastHistory
Frederik Seiffert provides this nifty tool, LastHistory, to visualize your Last.fm listening history.…
-
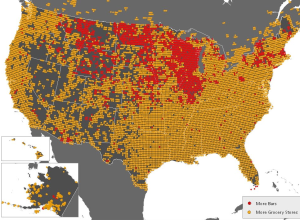
Where Bars Trump Grocery Stores
FloatingSheep, a fun geography blog, looks at the beer belly of America. One…
-
The State of the Internet
From JESS3 is this video on the state of the internet. It’s essentially…
-
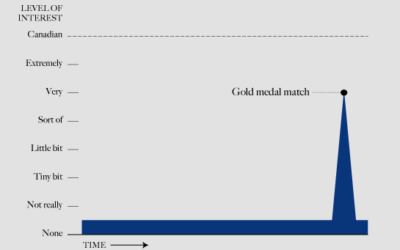
Data Underload #11 – American Hockey
American interest in hockey went from practically zero to near Canadian status.
Recently for Members
Second Edition
 Visualize This: The FlowingData Guide to Design, Visualization, and Statistics (2nd Edition)
 Visualize This: The FlowingData Guide to Design, Visualization, and Statistics (2nd Edition)
New tools, refined process.
Browse by Chart Type See All →


