By now, everyone’s heard of Moneyball. Applying statistics to baseball to build the best team for the buck. Naturally, there’s a lot of interest these days in applying the same data-based philosophy to other sports. Jennifer Fewell and Dieter Armbruster used network analysis to model gameplay in basketball.
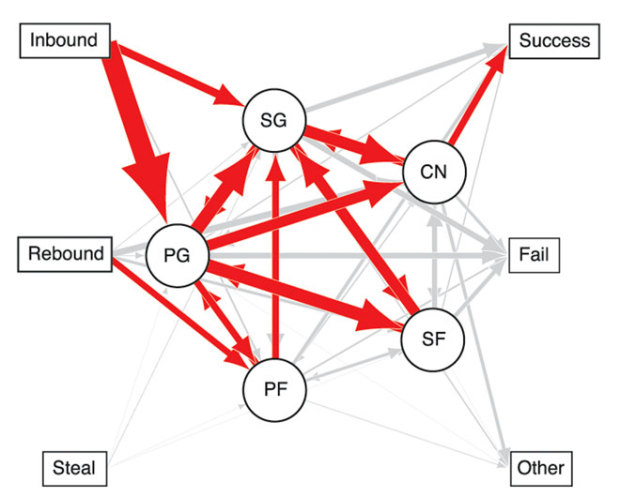
To analyze basketball plays, Fewell and Armbruster used a technique called network analysis, which turns teammates into nodes and exchanges — passes — into paths. From there, they created a flowchart of sorts that showed ball movement, mapping game progression pass by pass: Every time one player sent the ball to another, the flowchart lines accumulated, creating larger and larger and arrows.
Using data from the 2010 playoffs, Fewell and Armbruster’s team mapped the ball movement of every play. Using the most frequent transactions — the inbound pass to shot-on-basket — they analyzed the typical paths the ball took around the court.
The challenge with basketball is that play is continuous, whereas baseball events are discrete, so you can’t apply the same methods. But if you can model the game properly, you know where to optimize and areas that need work.

 Visualize This: The FlowingData Guide to Design, Visualization, and Statistics (2nd Edition)


