ReConstitution 2012, a fun experiment by Sosolimited, processes transcripts from the presidential debates, and recreates them with animated words and charts.
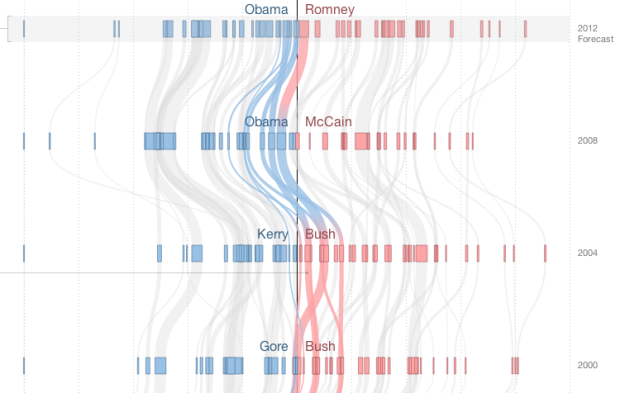
Part data visualization, part experimental typography, ReConstitution 2012 is a live web app linked to the US Presidential Debates. During and after the three debates, language used by the candidates generates a live graphical map of the events. Algorithms track the psychological states of Romney and Obama and compare them to past candidates. The app allows the user to get beyond the punditry and discover the hidden meaning in the words chosen by the candidates.
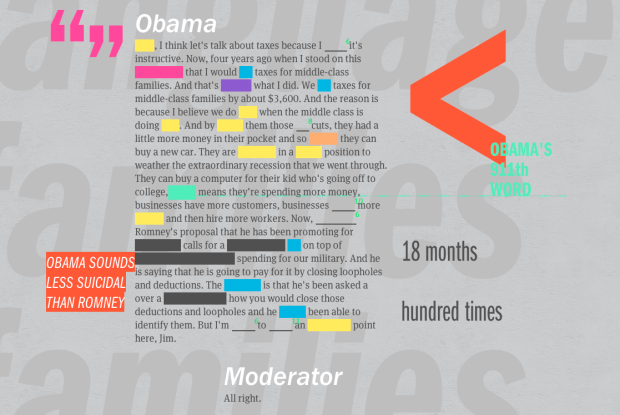
As you let the transcript run, numbers followed by their units (like “18 months”) flash on the screen, and trigger words for emotions like positivity, negativity, and rage are highlighted yellow, blue, and red, respectively. You can also see the classifications in graph form.
There are a handful of less straightforward text classifications for truthy and suicidal, which are based on linguistic studies, which in turn are based on word frequencies. These estimates are more fuzzy. So, as the creators suggest, it’s best not to interpret the project as an analytical tool, and more of a fun way to look back at the debate, which it is. It’s pretty fun to watch.
Here’s a short video from Sosolimited for more on how the application works:
 From the October 10 Boston Metro. Oops. [
 Visualize This: The FlowingData Guide to Design, Visualization, and Statistics (2nd Edition)


