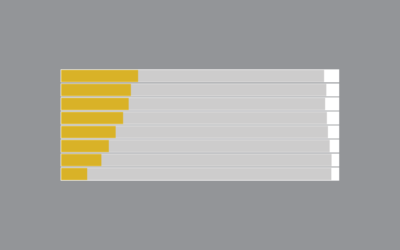
Stacked Bar Chart
With the stacked version of the bar, compare subcategories across groups. Try not to show too many subcategories though, or it’ll clutter quick.
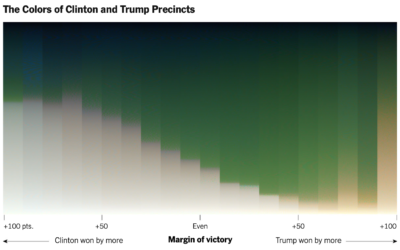
Red-blue electoral map and the green-gray in satellite imagery
For NYT’s The Upshot, Tim Wallace and Krishna Karra looked at how the…
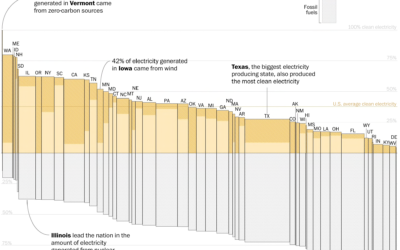
Electricity sources by state
With Joe Biden calling for 100% clean electricity, John Muyskens and Juliet Eilperin…
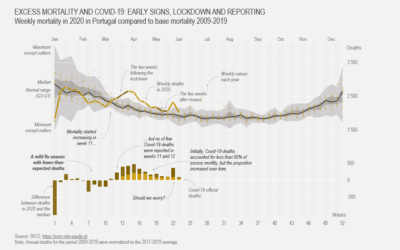
How to Make a Customized Excess Mortality Chart in Excel
Show current evolution against expected historical variability and add one or more series that could account for the difference.
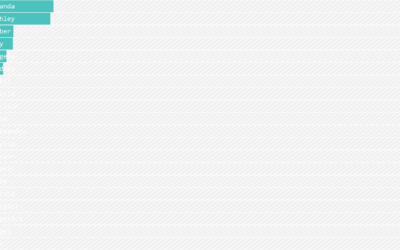
Guessing Names Based on What They Start With
I'm terrible at names, but maybe data can help. Put in your sex, the decade when you were born, and start putting in your name. I'll try to guess before you're done.
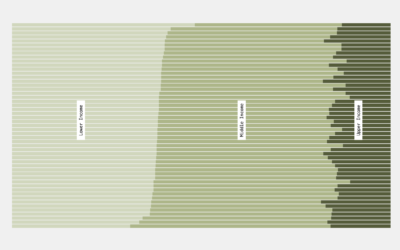
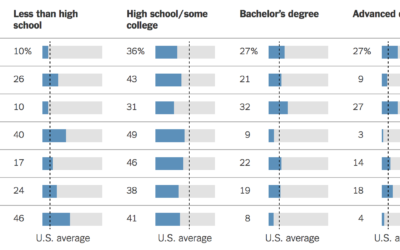
Percentage of Households in Each Income Level
What percentage of households fall into lower-, middle-, and upper-income levels when you adjust for household size?
Baby-Making Age
We looked at prime dating age and when people usually marry. Now it's time for the next step in the circle of life.
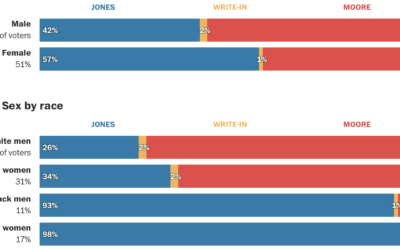
Alabama voter demographics
Democrat Doug Jones won in the senate race against Republican Roy More last…

Demographics for immigrants from banned countries
As I’m sure you know, the current administration banned immigrants from seven countries…

How to Visualize Proportions in R
There are many ways to show parts of a whole. Here are quick one-liners for the more common ones.
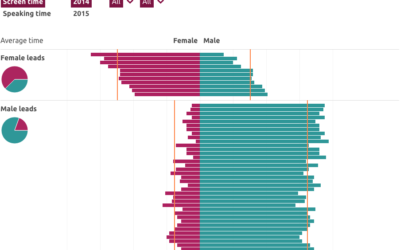
Computed screen time for men and women
In a collaborative effort, the Geena Davis Institute on Gender in Media computed…
Who Still Smokes?
Two decades out from the first statewide ban on smoking in enclosed workplaces, here's who still smokes.
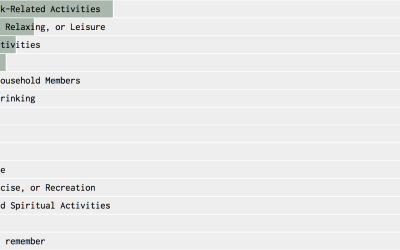
Most Common Use of Time, By Age and Sex (2015)
Typical time use varies by who you talk to. This interactive shows you the differences when you vary age and sex.
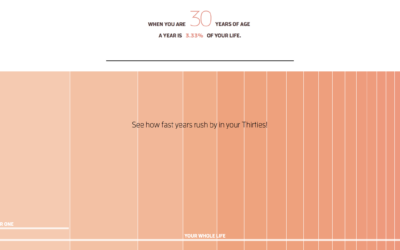
Why time flies when you’re older
When you’re a kid, a year seems like forever. Appending “and a half”…
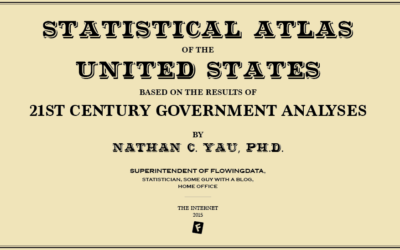
Reviving the Statistical Atlas of the United States with New Data
Due to budget cuts, there is no plan for an updated atlas. So I recreated the original 1870 Atlas using today's publicly available data.
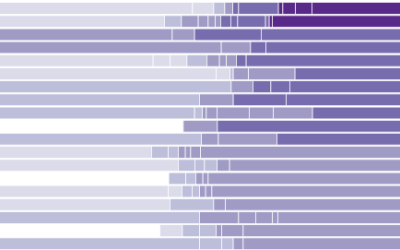
State Income Tax Brackets Charted
I’m sure you finished your taxes months ago, but here’s a chart of…
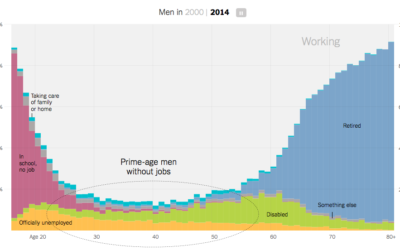
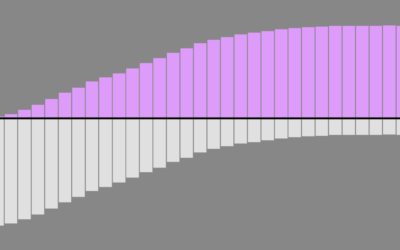
Increasing rates of men who don’t work
Recent data from the Census Bureau suggests the rate of non-working men has…