Heatmap
Cells or bins are colored based on data. As with all visualization types that use color as the main visual encoding, choose shades carefully.
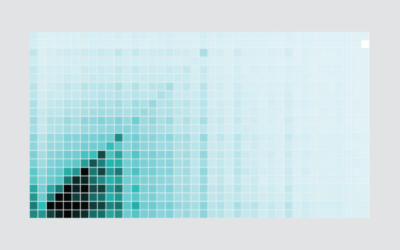
How I Made That: Interactive Heatmap
Add interaction so that you can show different segments of the data and allow comparisons.
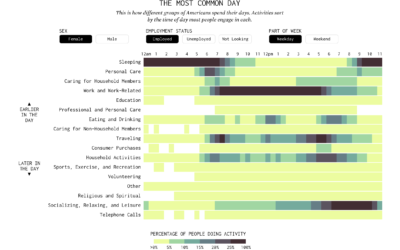
American Daily Routine
Sleep. Work. Play. The times and everything in between change depending on who you talk to.
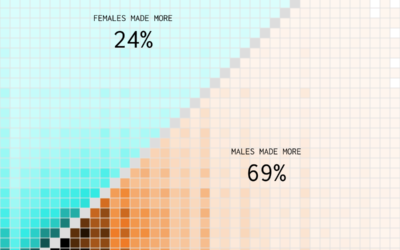
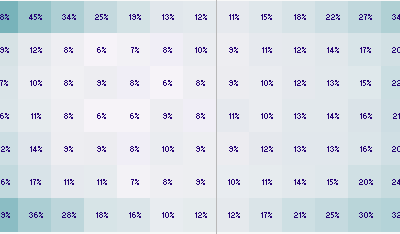
Who Earns More Income in American Households?
Compared to 1970, a shift towards women making the higher income.
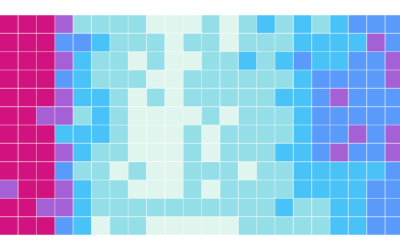
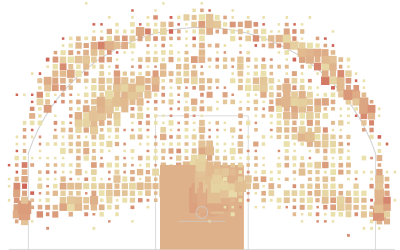
Fatal Traffic, When and Where
These are the traffic crashes that resulted in deaths in 2015, categorized by month, time of day, and factors involved.
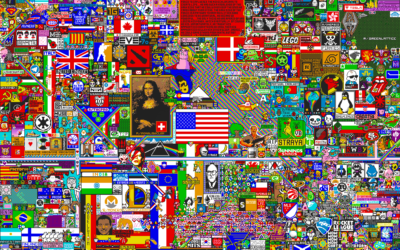
Time-lapse of community-edited pixels
For April Fool’s Day, Reddit ran a subreddit, r/place, that let users edit…
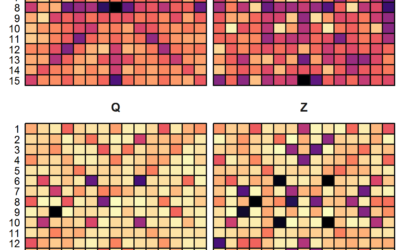
Scrabble data and analysis
Looking for some data to play with? James P. Curley compiled Scrabble data…
Where to Find Jeopardy! Daily Doubles
Placement of Daily Double clues, from season 1 to 31. Watch them play out.
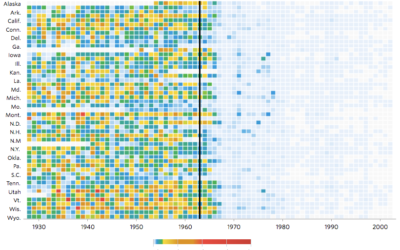
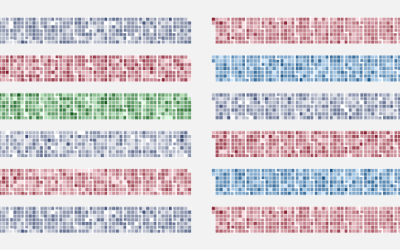
Impact of vaccines throughout history
Not that anyone who does not vaccinate their kids cares, but Tynan DeBold…
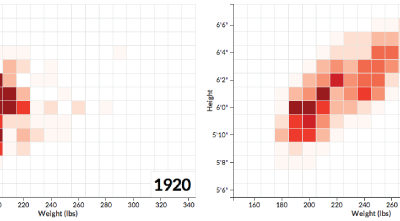
NFL players getting bigger
Football players are getting bigger. Noah Veltman, a developer for the WNYC Data…
Five years of traffic fatalities
I made a graphic a while back that showed traffic fatalities over a…
More on Making Heat Maps in R
You saw how to make basic heat maps a while back, but you might want more flexibility for a specific data set. Once you understand the components of a heat map, the rest is straightforward.
Calendar Heatmaps to Visualize Time Series Data
The familiar but underused layout is a good way to look at patterns over time.
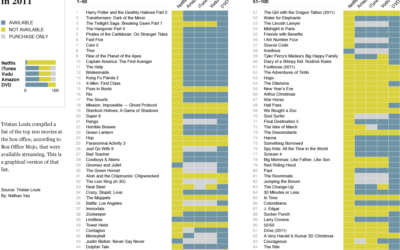
Where are the biggest box office movies (not) streaming?
After seeing Tristan Louis' list that tallied the streaming availability of 2011's top 100 box office hits, I was curious what it looked like graphically.
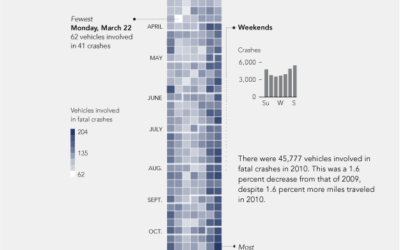
Vehicles involved in fatal crashes
After seeing a map in The Guardian, I was curious about what other data was available from the National Highway Traffic Safety Association. It turns out there's a lot.
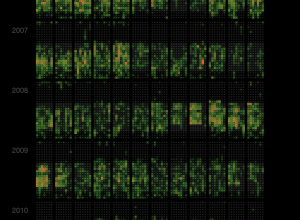
Last.fm scrobbles as calendar heat map
Martin Dittus, a former Last.fm employee, grabbed listening data for staff, moderators, and…
How to Make a Heatmap – a Quick and Easy Solution
A heatmap is a literal way of visualizing a table of numbers, where you substitute the numbers with colored cells. This is a quick way to make one in R.