Where to Find Jeopardy! Daily Doubles
In 2014, Jeopardy! fans criticized contestant Arthur Chu for skipping around the board instead of opting for the traditional top to bottom selection of clues. He was on the hunt for Daily Doubles, and as the 74-time winner Ken Jennings pointed out, Chu’s strategy was a good one. It’s in a good player’s best interest to remove the major elements of chance.
The key word in that last sentence is “good.” Armed with horrible recall and near-zero trivia knowledge, I wouldn’t benefit a whole lot. My wife on the other hand would fair much better.
So where can one find Daily Doubles? Most regular watchers can tell you it’s towards the bottom. But we can be more accurate than that.
The fan-maintained J! Archive keeps record of clues, dating back to the first season of the show’s current version. Unfortunately the J! Archive doesn’t have records for every episode. That doesn’t start until the 14th season. However, percentages for Season 14 and on versus the total of all clues on record don’t seem to change that much.
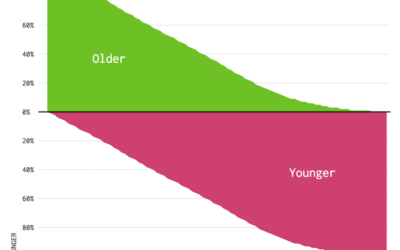
I collected data on Daily Doubles — 13,663 of them at the time, and ta-da, the board above. The darker the blue, the higher the percentage of Daily Doubles from that spot.
The bottom area is where a lot of the action is (as expected), and about 38 percent of Daily Doubles were found in the fourth row. The fourth row in the first column has the highest rate of Daily Doubles, and you’ll have less luck in the second and last columns. This pattern doesn’t seem to change much season to season.
Chart Type Used

Become a member. Support an independent site. Get extra visualization goodness.
See What You Get