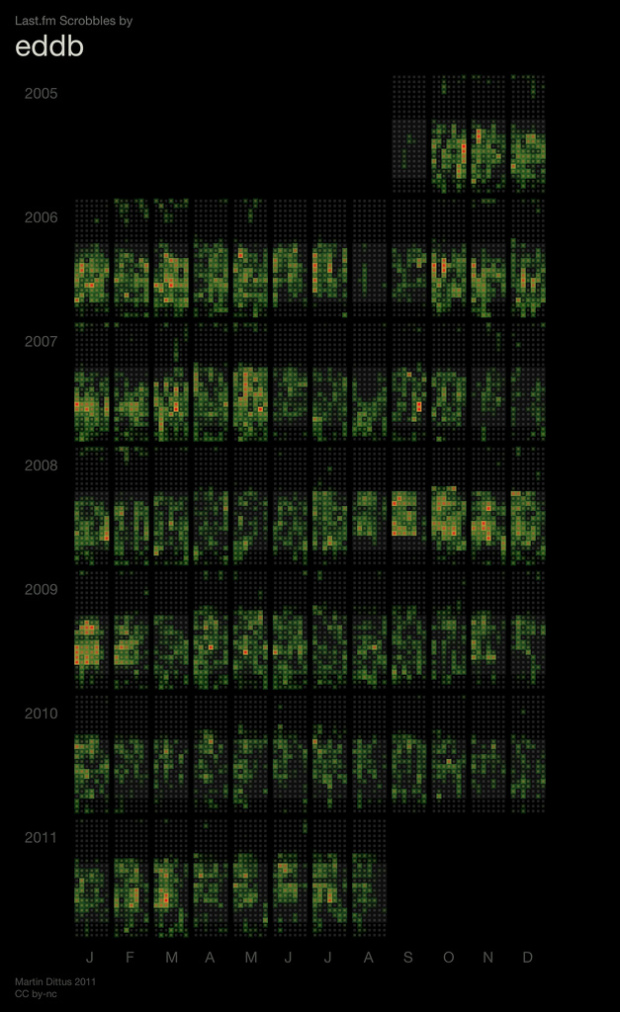
Martin Dittus, a former Last.fm employee, grabbed listening data for staff, moderators, and alumni, and visualized 8.7 million scrobbles in an extended calendar format.
At its most basic level this visualisation shows how frequently someone has been scrobbling over time, which in itself probably isn’t that interesting. But the particular layout reveals some patterns in everyone’s listening habits that aren’t obvious from just looking at a timeline. Lunch breaks, dinner, the commute — as long as it happens regularly and interferes with one’s music listening you should have no trouble finding it in the graph. In a few graphs you can even see seasonal effects!
There is a row for each year from 2005 to 2011, and each wide column represents a month, hence 12 across. Each small row, within an annual row, is an hour per day, and each small column, within each monthly column, is an hour of the day. Days of the week were aggregated for each month, so each month is a 7 by 24 grid. Make sense?
It’s like a calendar view, but instead days, the interest is centered around hours of the day. Deeper orange indicates more activity.
There are about 180 graphs, one for each person Dittus produced a graphic for. Most likely you aren’t one of them or know any of them, but I like the use of the calendar-like grid to look for temporal patterns. It’s an under-utilized layout that should be played with more.


 Visualize This: The FlowingData Guide to Design, Visualization, and Statistics (2nd Edition)