Visualization
Showing the stories in data through statistics, design, aesthetics, and code.
Search trends during the pandemic
As you would imagine, what we search for online shifted over the past…
Visualization helping us during the pandemic
Hayleigh Moore for the College of Information Studies at the University of Maryland…
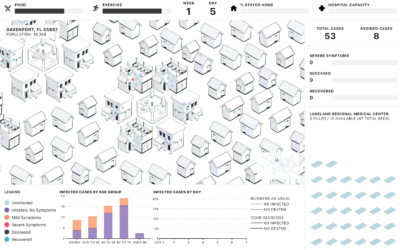
People of the Pandemic, a game that simulates social distancing in your ZIP Code
People of the Pandemic is a game that lets you choose how many…
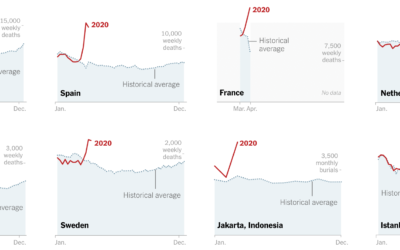
Missing deaths
The daily counts for coronavirus deaths rely on reporting, testing, and available estimates,…
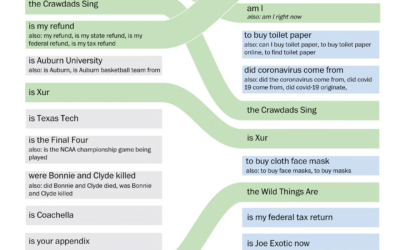
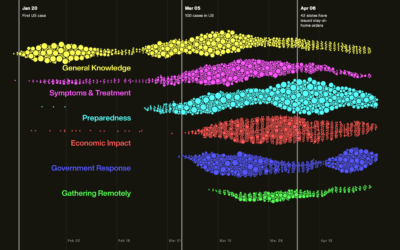
Change in Google searches since the virus
The coronavirus changed what information we search for. Has anyone been more interested…
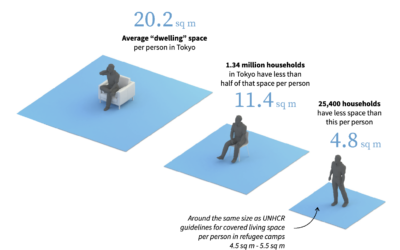
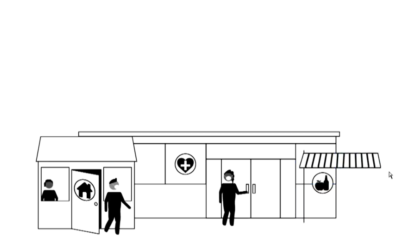
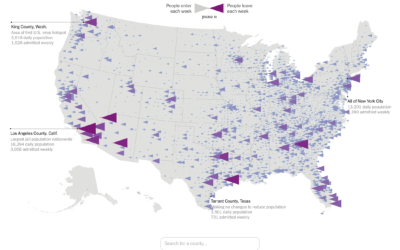
Sheltering in small places
For many, sheltering in place means sheltering in relatively small places. Reuters zoomed…
Historical data visualization panel
Manuel Lima hosted a free online panel with Michale Friendly and Sandra Rendgen…

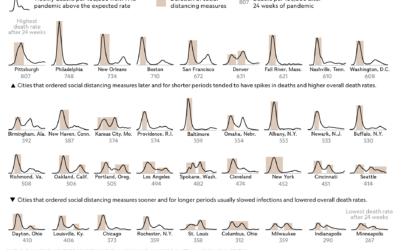
Curves for the 1918 flu pandemic
For National Geographic, Nina Strochlic and Riley D. Champine look back at the…

Simulation of droplets while social distancing
Using 3-D simulation data from the Kyoto Institute of Technology, The New York…

Social distancing demonstrated with balls and mousetraps
The Ohio Department of Health released this video to show the advantages of…
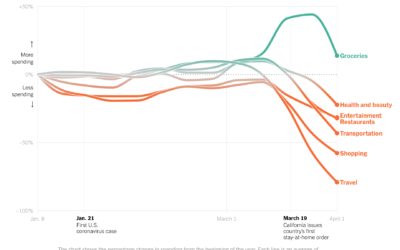
Change in consumer spending since the virus
Consumer spending has shifted dramatically since most people have to stay at home.…
Stay-at-home orders seen through decreased seismic activity
The pandemic has affected all parts of life, which can be seen from…
Flow of prison population
In a collaboration between The Marshall Project and The Upshot, Anna Flagg and…
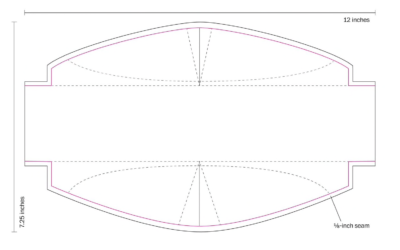
How to sew a mask, with a template
The Washington Post provides clear instructions on how to sew your own mask.…
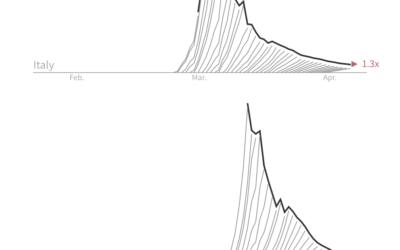
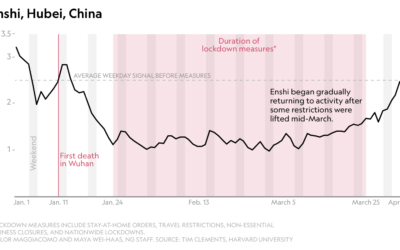
Slowing down the rate of deaths, aka breaking the wave
For Reuters, Jon McClure looks at the death counts for each country from…
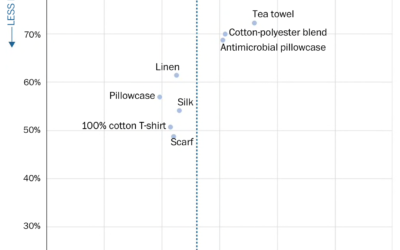
DIY masks, balancing filtration and breathability
The CDC now recommends that you wear a cloth face mask if you…