Maps  / 

Map of all the trees and forests

Mar 11, 2020

EarthArtAustralia mapped all of the trees and forests in the United States, based on data from researchers Hansen et al. at the University of Maryland.

We’ve seen minimalist maps like this before, but the introduction of 90m digital elevation data provides another dimension:
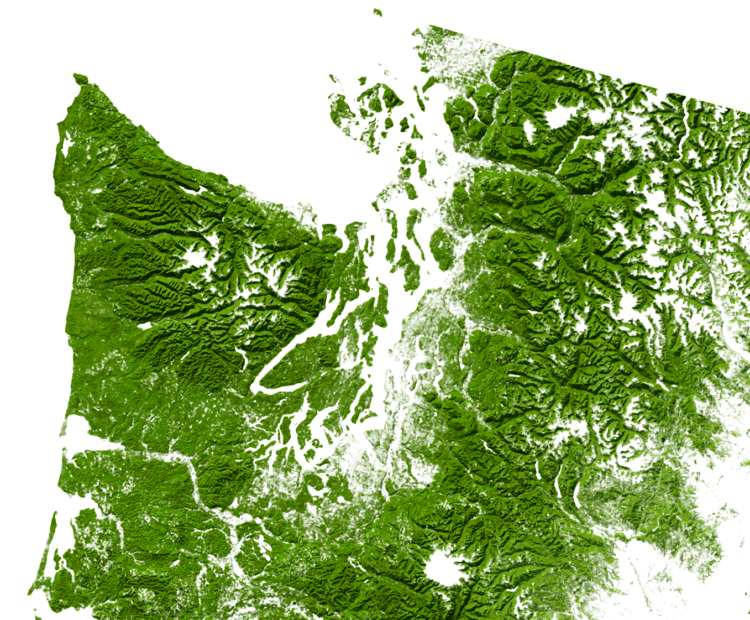
Pretty.

This map, among many others, is also available in poster form.

Become a member. Support an independent site. Make great charts.

See What You Get

Learn to Visualize Data See All →

How to Make Square Pie Charts in R

Instead of traditional pie charts that rely on angles and arc lengths to show parts of a whole, try this easier-to-read version.

How to Make Interactive Linked Small Multiples

Small multiples are great, and the right interactions can make them even better. A primer and a how-to.

How to Make an Interactive Stacked Area Chart

Stacked area charts let you see categorical data over time. Interaction allows you to focus on specific categories without losing sight of the big picture.

How to Make a Bump Chart in R

Visualize rankings over time instead of absolute values to focus on order instead of the magnitude of change.

Favorites

Seeing How Much We Ate Over the Years

How long will chicken reign supreme? Who wins between lemon and lime? Is nonfat ice cream really ice cream? Does grapefruit ever make a comeback? Find out in these charts.

One Dataset, Visualized 25 Ways

“Let the data speak” they say. But what happens when the data rambles on and on?

The Most Unisex Names in US History

Moving on from the most trendy names in US history, …

Marrying Age

People get married at various ages, but there are definite trends that vary across demographic groups. What do these trends look like?