Visualization
Showing the stories in data through statistics, design, aesthetics, and code.
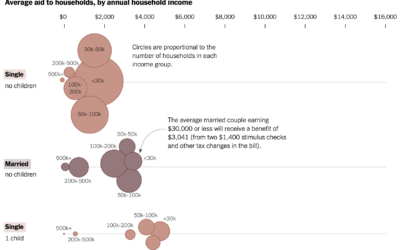
Average stimulus aid, by household size and income
Alicia Parlapiano and Josh Katz, reporting for NYT’s The Upshot, plotted the average…
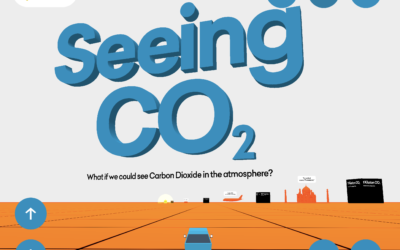
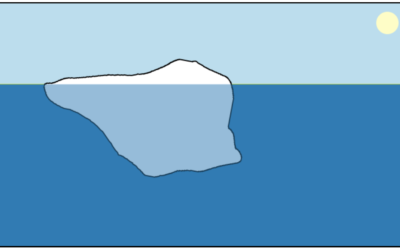
Seeing CO2 is a playable data visualization
Seeing CO2, by design studio Extraordinary Facility, is a playable data visualization that…
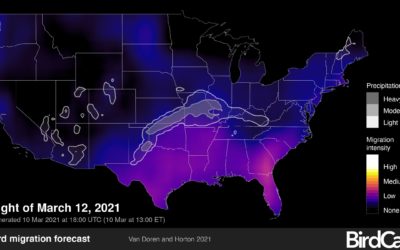
Bird migration forecast maps
BirdCast, from Colorado State University and the Cornell Lab of Ornithology, shows current…
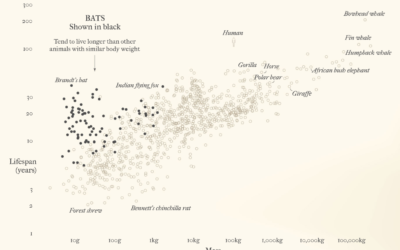
Bats and outbreaks
For Reuters, Julia Janicki and Simon Scarr, with illustrations by Catherine Tai, show…
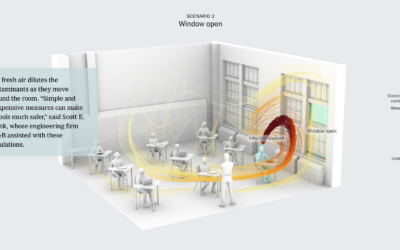
Schools should open their windows for ventilation
As schools begin to reopen, The New York Times illustrates why classrooms should…
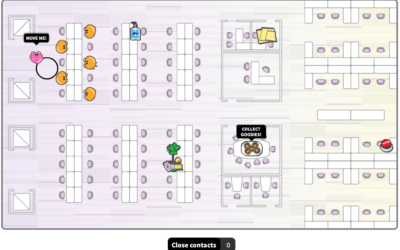
Social distancing when we’re back in the office
For Reuters, Sarah Slobin and Feilding Cage imagine life back at the office…
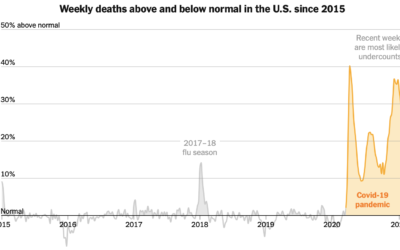
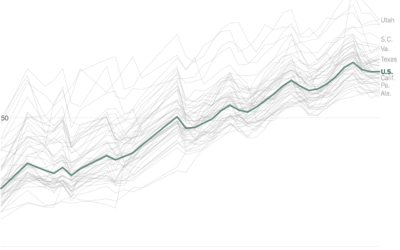
Scale of the pandemic compared to the past
While we’re on the topic of scale, The New York Times plotted weekly…
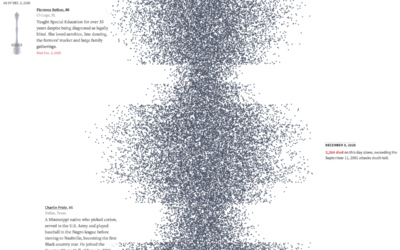
500,000 lives lost, an individual scale
The United States passed the half million mark for confirmed Covid-19 deaths. It’s…

Bird flight patterns captured through long-exposure photography
For several years, Xavi Bou has been using long-exposure photography to capture stills…
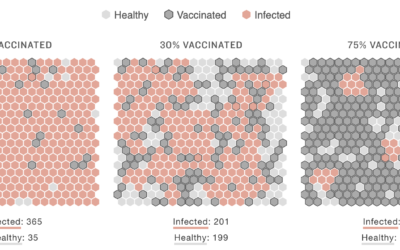
Simulation for different immunity scenarios
As vaccinations roll out, we work towards herd immunity, there are various challenges…
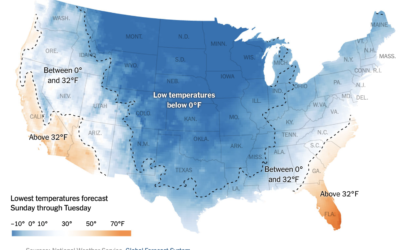
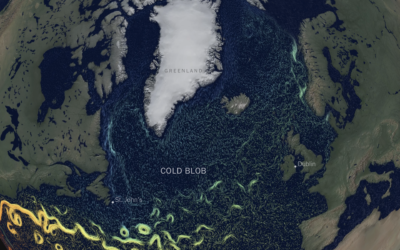
Low temperatures map of the United States
Based on data from the Global Forecast System, The New York Times mapped…
Improving vaccine distribution in all states
Lauren Leatherby and Amy Schoenfeld Walker reporting for The New York Times:
“Every…
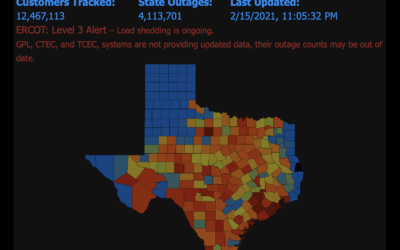
Map of power outages
PowerOutage.US keeps a running tally of outages across the United States, and it’s…
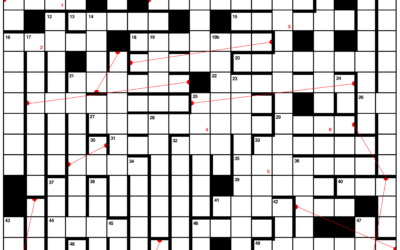
Data visualization crossword puzzle
This is fun. Lisa Charlotte Rost made a data visualization crossword puzzle. Print…
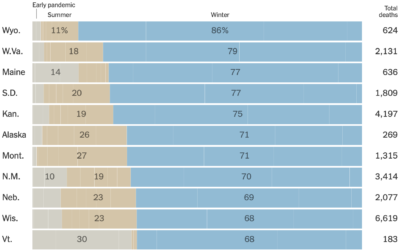
Half of coronavirus deaths were in the winter
You probably knew that coronavirus deaths have been in the several thousands per…
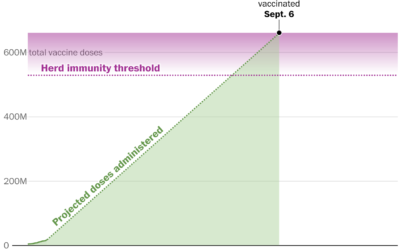
How quickly the U.S. is vaccinating vs. how long it’ll take to get back to “normal”
Vaccines provide light at the end of the tunnel, but when we finally…