Visualization
Showing the stories in data through statistics, design, aesthetics, and code.
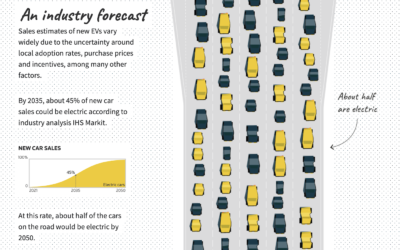
Improving electric vehicle adoption rates
Gas-powered vehicles contribute a big part of total carbon production, so to get…
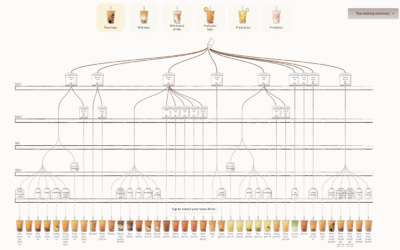
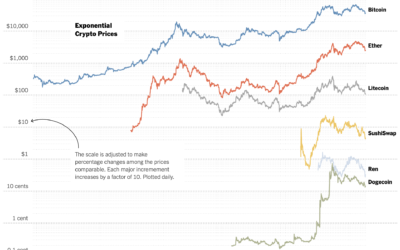
Bubble tea combinations, a visual breakdown
Walk into a boba shop and usually you’ll see a large menu that…
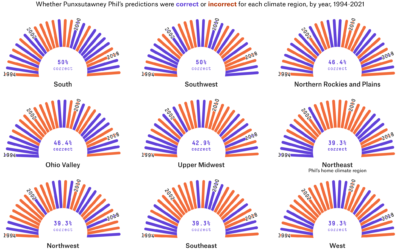
Accuracy of groundhog weather prediction
For FiveThirtyEight, Simran Parwani and Kaleigh Rogers compared Groundhog Day predictions against actual…
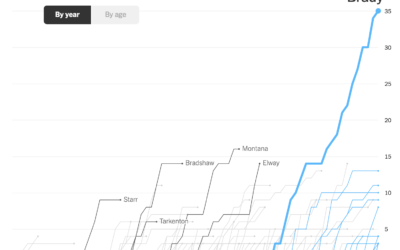
Charts showing Tom Brady’s standout career
Tom Brady announced his retirement from the National Football League, which ends a…
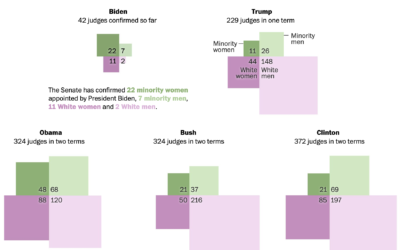
Diversity of federal judge picks, compared by president
Adrian Blanco for The Washington Post used squares connected at the corners to…
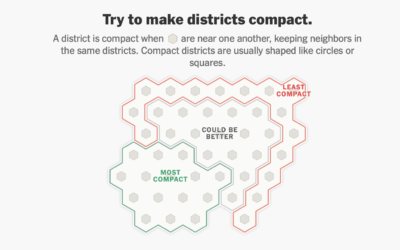
A game to gerrymander your party to power
Ella Koeze, Denise Lu, and Charlie Smart for The New York Times made…
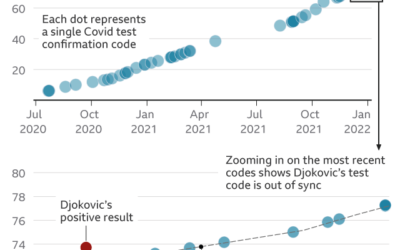
Questioning Novak Djokovic’s Covid tests, based on data
Tennis player Novak Djokovic is not vaccinated against the coronavirus, and as a…

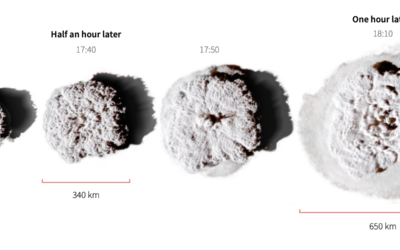
Scale of the Tonga eruption
Manas Sharma and Simon Scarr used satellite imagery to show the scale of…

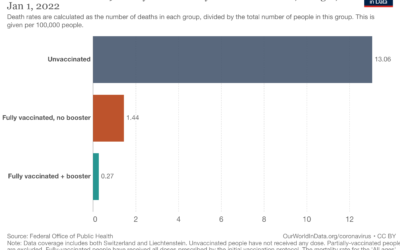
Death rates by vaccination booster status
Our World in Data continues their important work on providing and showing up-to-date…
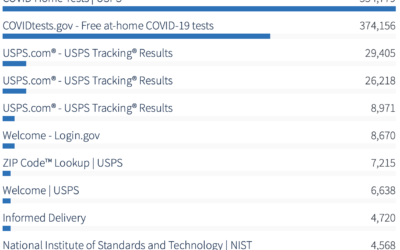
Analytics for U.S. government websites
With the announcement of free Covid-19 tests through the United States Postal Service,…

Global ripple effect from underwater volcano
An underwater volcano erupted about 40 miles off the coast of the main…

A visual and audio tour of sound at Nap Nap Swamp
When I think swamp noise, I imagine a blob of sound that’s some…
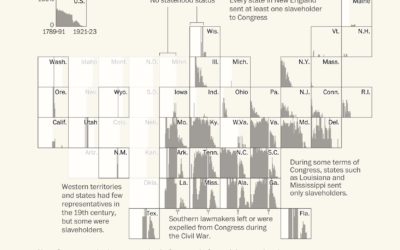
Congressmen who enslaved people
Using old Census records and documents, Julie Zauzmer Weil, Adrian Blanco and Leo…
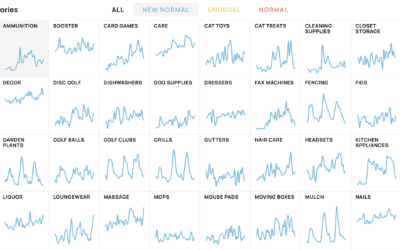
New shopping search patterns from the pandemic
Schema Design, Google Trends, and Axios collaborated on The New Normal, looking at…
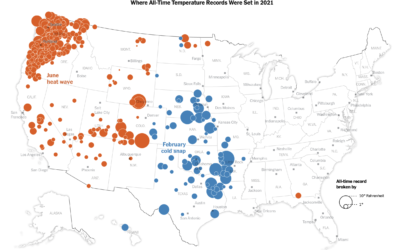
All-time temperature records broken in 2021
Using data from NOAA, Krishna Karra and Tim Wallace for The New York…