Visualization
Showing the stories in data through statistics, design, aesthetics, and code.
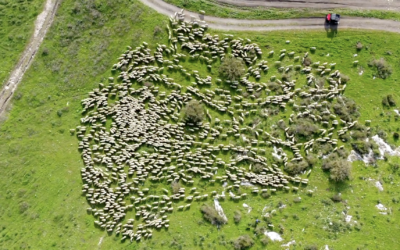
Sheep herding movements from above
[arve url=”https://vimeo.com/568430412″ loop=”no” muted=”no” /]
Aerial photographer Lior Patel followed a herd of…

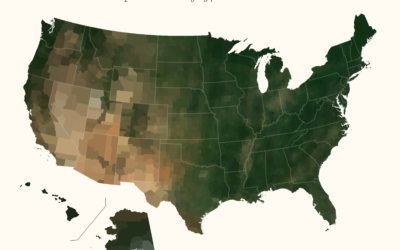
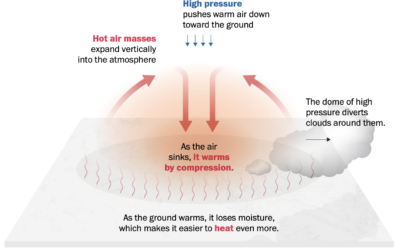
Historical context for the heat in the Pacific Northwest
It’s been hot in the Pacific Northwest the past few days. NYT’s The…
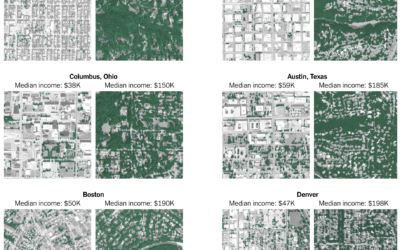
Average color of geographic areas
Based on satellite imagery, Erin Davis found the average color of places around…
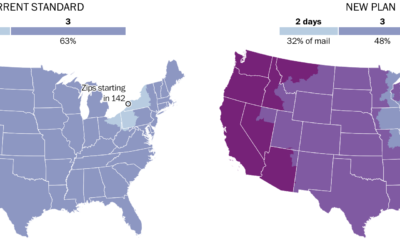
Mail slowdown
Postmaster General Louis DeJoy proposed new standards for first-class mail, which would slow…
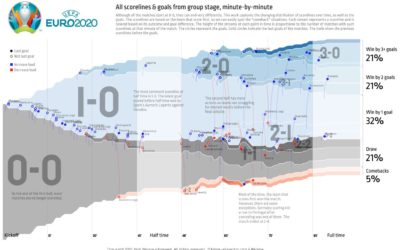
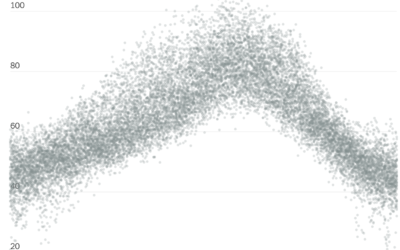
All the matches from Euro 2020 in one chart
To see all the matches from the group stage of Euro 2020 in…

How the ultrarich use a Roth IRA to get more rich
ProPublica continues their analysis of an anonymous IRS tax records dump. In their…
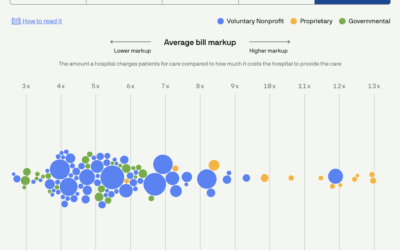
Scoring hospitals by billing quality
Using data collected by Johns Hopkins University, Michelle McGhee and Will Chase for…
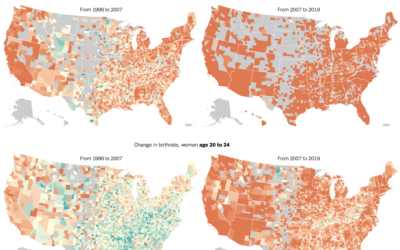
Delaying motherhood
The New York Times mapped birth rates, which are down almost everywhere, especially…
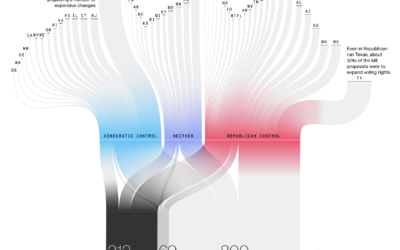
Passing restrictive voting bills
Bloomberg used a Sankey diagram to show the path of over a thousand…
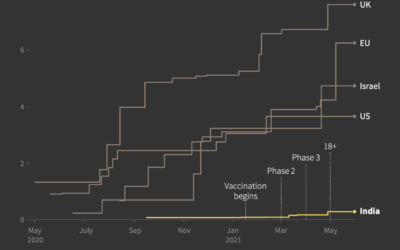
India vaccine procurement compared to other countries
Prasanta Kumar Dutta and Manas Mishra reporting for Reuters on the slow rollout…
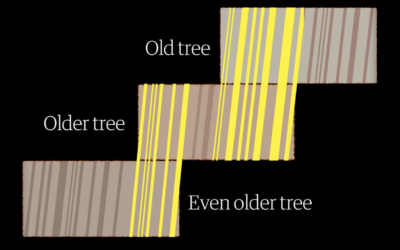
Measuring centuries-old droughts through tree rings
To measure drought in the present day, we use data from sensors that…
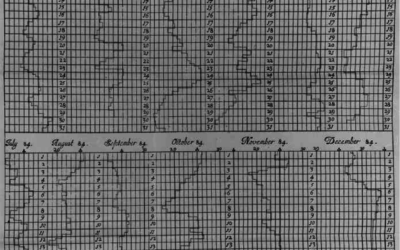
Graphs before anyone knew what they were
Michael Friendly and Howard Wainer have a new book out: A History of…

Collapse of Mexico City Metro explained
The New York Times investigated the collapse of the Metro, which killed 26…

xkcd: Base Rate
xkcd points out the importance of considering the baseline when making comparisons:…
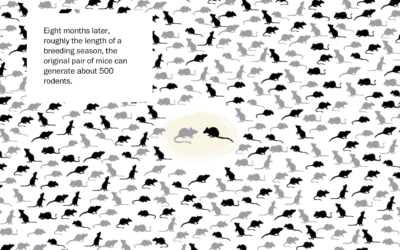
Scale of a mouse plague
There’s a mouse plague in Australia right now. The words alone don’t express…