Visualization
Showing the stories in data through statistics, design, aesthetics, and code.
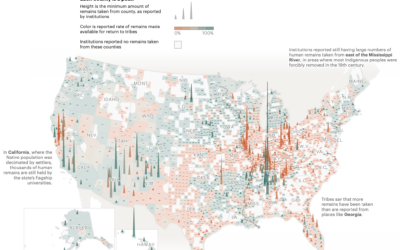
Unreturned Native American remains, mapped
A law was passed in 1990 that allowed Native American tribes to request…

Meaning of the Chinese New Year meal
In celebration of Chinese New Year, Julia Janicki, Daisy Chung, and Joyce Chou…
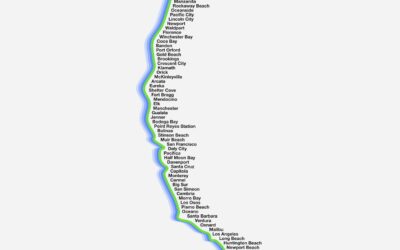
Barely a map of the west coast
Barely Maps is an ongoing project by Peter Gorman that shows geographic data…
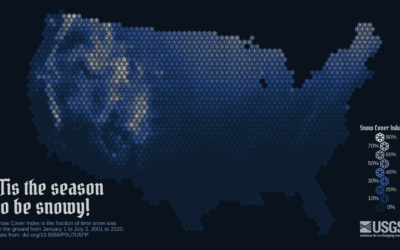
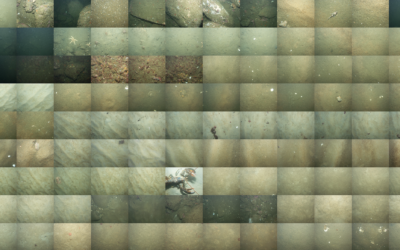
Snow cover mapped using snowflakes
To show snow cover across the United States, Althea Archer for the USGS…
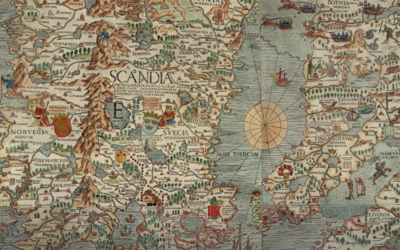
Origins of the world map
Mapping the entire planet is not exactly a straightforward thing to do, especially…

Animal extinction over time
Animals are going extinct at a faster rate. Reuters shows a developing pattern…
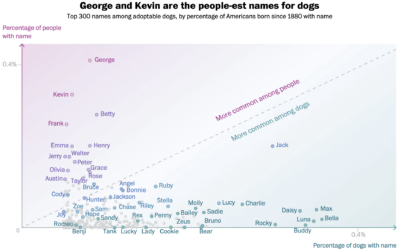
Names that are more dog or more human
There appears to be a trend of using human names for pets. Alyssa…

Best Data Visualization Projects of 2022
Every year, I pick my favorite data visualization projects, which tend to cover a wide range of purposes but are typically for presentation. Here are my favorites for 2022.
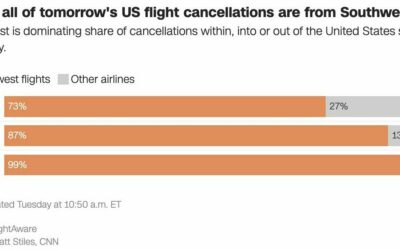
Southwest flight cancellations
There were a lot of flight cancellations this week, but Southwest Airlines is…
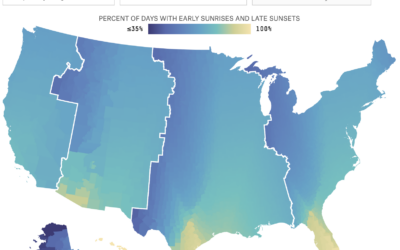
Apply your daylight saving preferences to the rest of the country
We like to complain about changing time an hour back or forward, and…
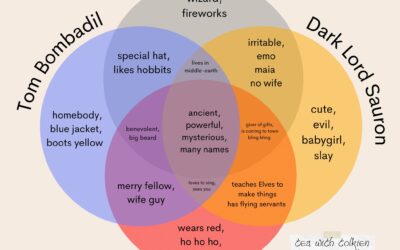
Lord of the Rings and Santa Venn diagram
Kaitlyn Facista, of Tea with Tolkien, made a four-part Venn diagram that shows…
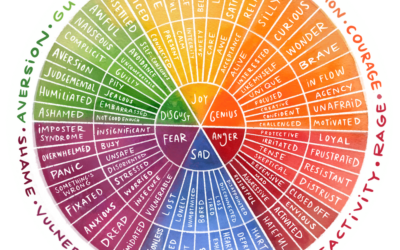
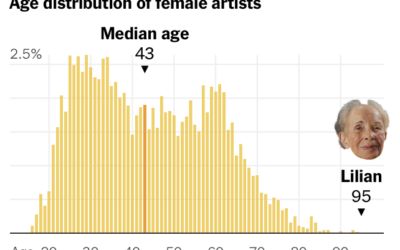
Visual exploration through emotional granularity
We often talk about emotions in more basic terms, such as disgust, joy,…
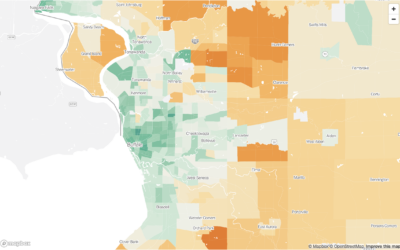
Carbon footprint in the city versus the suburbs
Bringing it down the Census tract level, Nadja Popovich, Mira Rojanasakul and Brad…
VIS 2022 talks are online
With the holidays just about here, I’m sure there’s nothing you’d rather do…