Visualization
Showing the stories in data through statistics, design, aesthetics, and code.
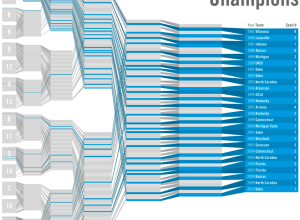
March Madness bracketology – winners and losers
Working off last year’s bracketology graphic, Leonardo Aranda took a simpler approach in…
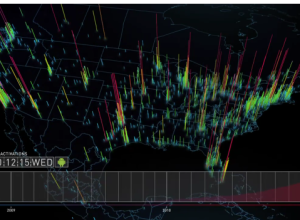
Global Android activations mapped and animated
iPhone gets all the glory, but there are plenty of Android phones activated…
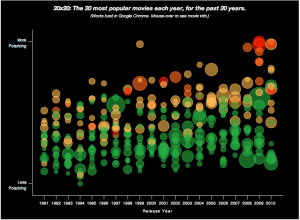
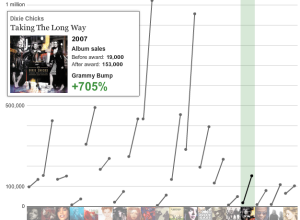
Visual evidence that movies are getting worse
Moki takes a page out of the OkCupid social media playbook and analyzes…

Painting with light to show WiFi networks
WiFi is everywhere, floating and whirling around us somehow, but where is it…
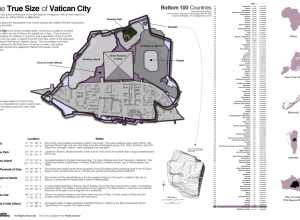
True size of Vatican City
We saw the true size of Africa, relative to the world’s largest countries,…

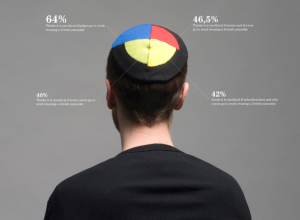
Data visualization meets game design to explore your digital life
The list of one-off applications that visualize your digital life, whether it be…
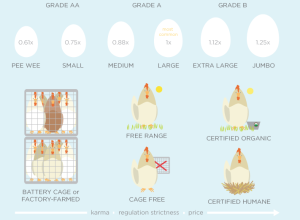
Who drinks the most around the world?
What and how much people drink depends a lot on what country you’re…
America is not the best at everything
Charles M. Blow has a look at some metrics for the International Monetary…
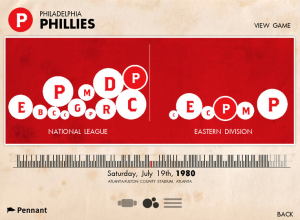
Every baseball game and play since 1951 on your iPad
If you love baseball and have an iPad, you need Pennant, a project…
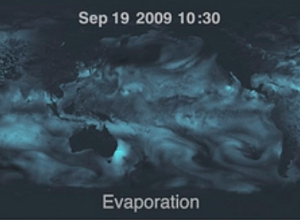
Components of the global water cycle
NASA briefly explains the water cycle:
Water regulates climate, predominately storing heat during…
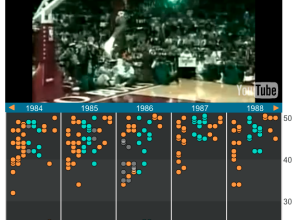
History of the dunk contest complete with videos
Here’s something to chew on while you wait for the 2011 slam dunk…
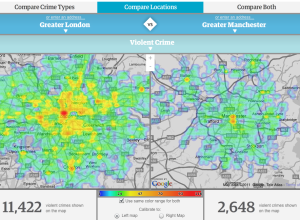
England crime map comparisons
After a sluggish launch by police.uk to unleash local crime data, the Guardian…
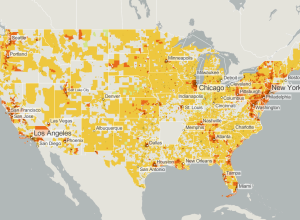
National Broadband Map shows how connected your community is
To encourage the integration of broadband and information technology into local economies, the…
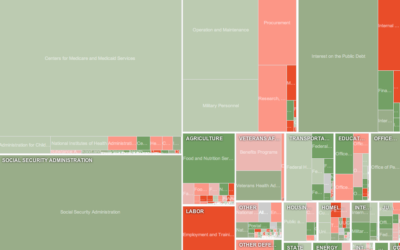
Exploratory treemap for Obama’s 2012 budget proposal
It’s that time of year again. Obama recently released his 2012 budget proposal…
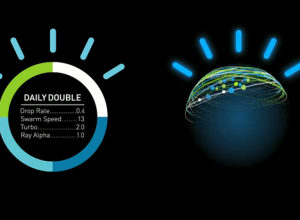
Reading the face of IBM’s Watson
Tonight on Jeopardy, the first day of the IBM Watson challenge, Ken Jennings…