Visualization
Showing the stories in data through statistics, design, aesthetics, and code.

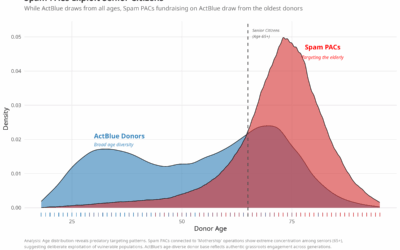
Deceiving seniors for political fundraising, like a Nigerian prince
Adam Bonica analyzed the age of donors across different groups and politicians. For…
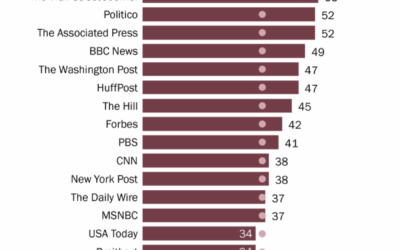
By news source, education levels of the audience
You probably have a rough idea of education levels for each audience, but…

Optimized onion cutting for the most uniform dice
For the Pudding, Andrew Aquino, with Russell Samora and Jan Diehm, supplies interactive…

Alcohol is amazing and also terrible
We know that alcohol is not the healthiest beverage to consume. When abused,…


Heat in prison cells
Reuters highlights unsafe temperatures in prison cells, using building models, public records, and…
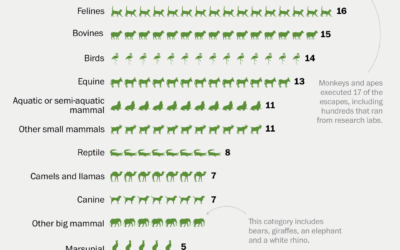
History of zoo animal escapes
It’s exciting when an animal escapes from the zoo. A monkey breaks free…
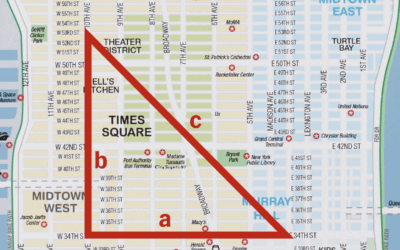
Taxicab Geometry
For the New York Times, Steven Strogatz explains taxicab geometry through the lens…
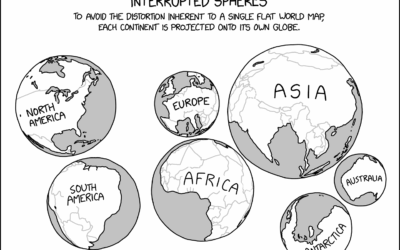
xkcd globe projections
The problem with two-dimensional map projections is distortion creeps in no matter what…
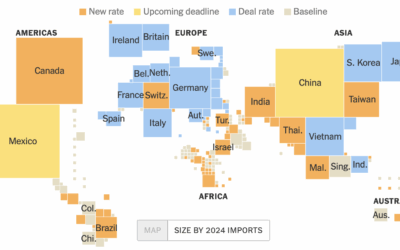

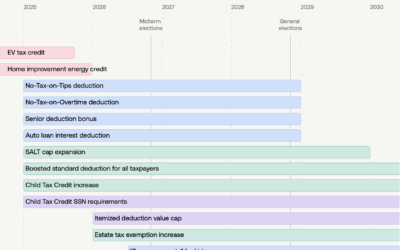
Policy timelines for the Big Beautiful Bill
The OBBB introduced policies for taxes, government assistance, student loans, and immigration, with…
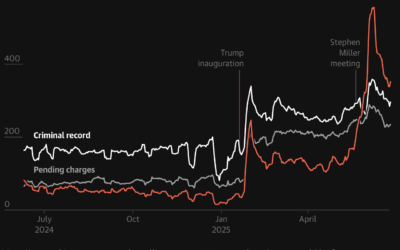
Increased immigration arrests and deportations
For the Guardian, Maanvi Singh, Will Craft, and Andrew Witherspoon show the sharp…
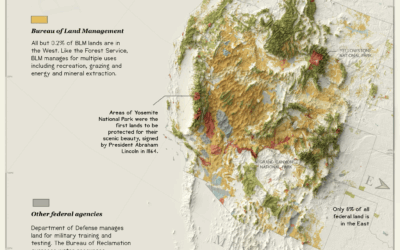
Usage and management of public lands
The administration is pushing policies to open public land, some 59 million acres…

Analysis of all the words used on NYC streets
Yufeng Zhao extracted words found in millions of publicly available Google Street View…
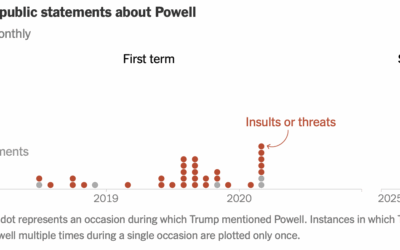
Counting Trump’s comments about Powell
For the New York Times, Christine Zhang counted Trump’s comments about Jerome Powell,…
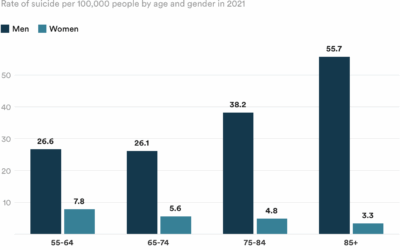
Highest suicide rates among older men in the U.S.
For STAT, Olivia Goldhill reports on an often overlooked demographic.
Meanwhile, another demographic…