Projects
Graphics by Nathan Yau, borne out of everyday curiosities, learning experiments, and mild insomnia.
Income in Each State, Adjusted for Cost of Living
A dollar might not buy you as much in one state as it does in the other.
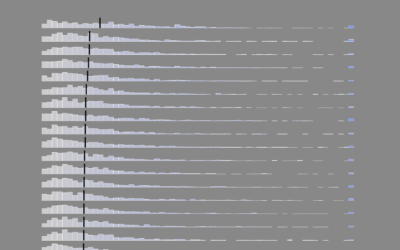
Career Timelines for Every Basketball Player Who Has Played an NBA Game
I was curious who played for a single team over their entire career, who skipped around, and how the patterns changed over the decades.
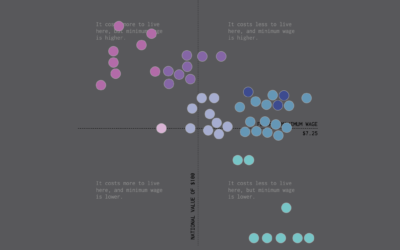
Minimum Wage and Cost of Living
We already looked at minimum wage over time, but when it comes to geography and income, you also have to consider the cost of living for a fair comparison.

How Much Minimum Wage Changed in Each State
Minimum wage has increased over the years, but by how much depends on where you live.
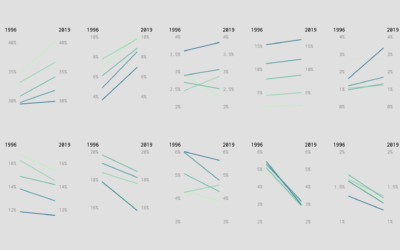
How Spending Changed for Different Income Groups
I compared spending in 1996 against the most recent spending estimates from the Bureau of Labor Statistics.
Unemployment and Occupation
Unemployment has hit some industries more than others. Here's how the most recent estimates compare against last year's.
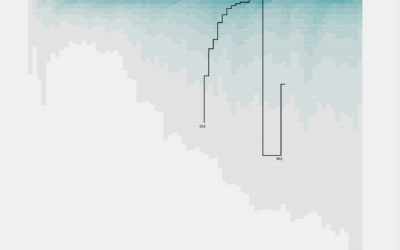
NBA Players Traded, Historical Percentages
It seems like there’s been more player movement than usual over the years. Didn’t players used to play on a single team for the entirety of their careers?
Leftover Turkey Flowchart
I roasted a turkey. There were a lot of leftovers. But my mom taught me to never waste.
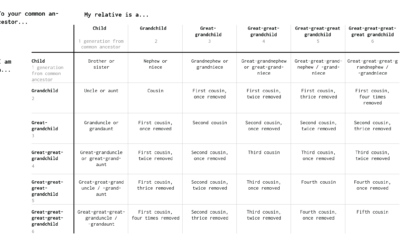
What to Call Your Distant Relative
When you have a big family, it's a challenge to figure out how everyone is related. So here are some charts to help you figure it out.

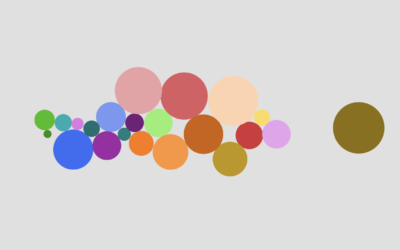
Waves of distraction
I’ve been distracted lately, so instead of making regular charts, I’ve been making…
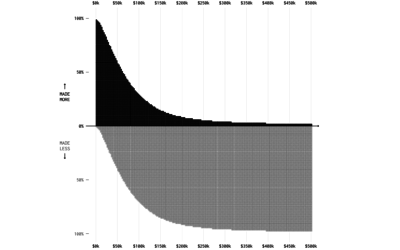
Who Makes More Money
Someone mentioned that $400,000+ per year was commonplace in American households. That seemed like an odd comment.
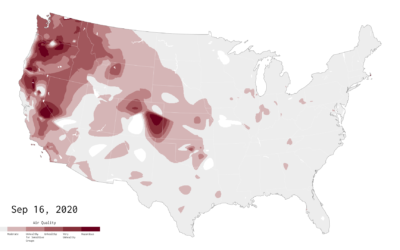
Air Quality Mapped Over Time
With wildfires burning in the western United States, smoke fills the air. This is an animation of the air quality during the past couple of months.
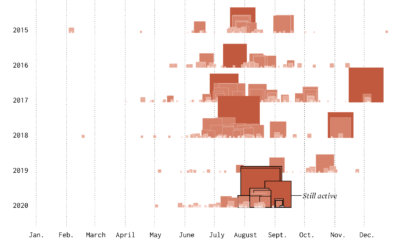
Timeline of California Wildfires
The wind was blowing smoke and ash from wildfires further up north from where I live. The sky turned an eerie orange. I wondered about past fires and made the chart below.
Multiple Causes of Death
There's a 6 percent figure from the CDC that could be easily misinterpreted. Here's what it means.