Multiple Causes of Death
A certain group cherrypicked a percentage from the Covid-19 weekly updates page maintained by the Centers of Disease Control and Prevention. On the page, a table shows other causes of death associated with Covid-19 deaths. The table description reads:
For 6% of the deaths, COVID-19 was the only cause mentioned. For deaths with conditions or causes in addition to COVID-19, on average, there were 2.6 additional conditions or causes per death. The number of deaths with each condition or cause is shown for all deaths and by age groups.
I can see how this could be easily misinterpreted. A sentence or screenshot from the CDC page says 6 percent, and people might think this means only a small percentage of Covid-19 deaths were actually from Covid-19. But all it means is that for 94 percent of recorded Covid-19 deaths, other causes were entered on the death certificate.
Here’s what the form looks like for the part that lists causes of death:
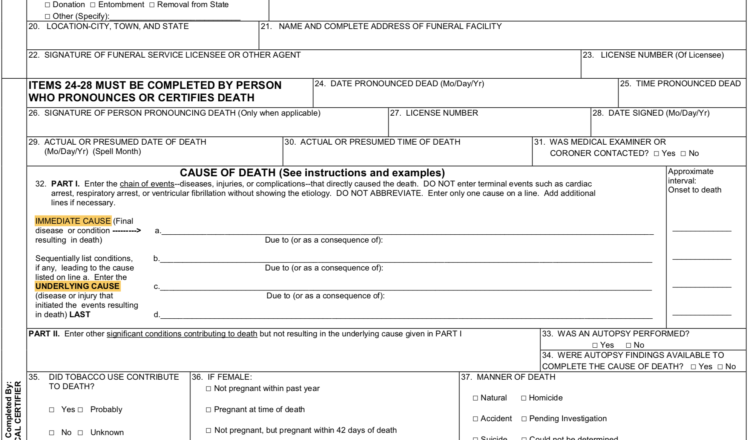
Notice the four lines, a to d, to provide multiple causes. There’s a line for immediate cause and three more lines for underlying causes that led to that immediate cause.
For 6 percent of Covid-19 death certificates, there was only one line filled out that specified the disease. The remaining certificates listed other causes — such as respiratory failure or cardiac arrest. With Covid-19 deaths, the disease leads to other things or makes existing conditions worse.
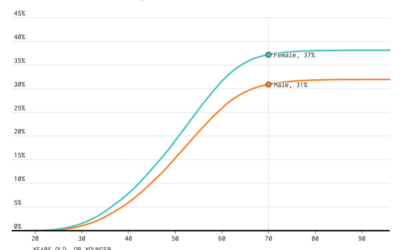
The chart below shows other causes of death listed with Covid-19, a.k.a. comorbidity.
Covid-19 Comorbidity
It is common for other causes of death to be listed with Covid-19.
As of writing this, the Covid-19 death count in the United States is at about 184,000. These deaths are very real.
But again, I can still see how the 6 percent figure bubbling across one’s feed could lead to confusion. So let’s look at a different cause of death that’s maybe more relatable: vehicle accidents.
If someone died in a car accident, you would probably say the cause of death was the car accident. However, the death certificate would likely list multiple causes like a head injury or a broken neck.
Vehicular Deaths
It is also common for other causes of death to be listed in this case.
Just because an additional cause of death is listed doesn’t mean the vehicle accident didn’t happen. Someone still died because of the car accident.
Covid-19 death estimates from the CDC should be interpreted in a similar way. Just because 94% of the deaths involved other causes doesn’t mean Covid-19 didn’t happen. People are still dying from Covid-19.
Notes
The vehicle accident data comes from CDC WONDER. There are several categories of accidents you can look at, but in this example I used “Person injured in unspecified motor-vehicle accident”, or ICD-10-CM code V89.2.
Chart Type Used

Become a member. Support an independent site. Get extra visualization goodness.
See What You Get