Who Makes More Money

Someone mentioned that $400,000+ per year was commonplace in American households. That seemed like an odd comment, so here’s a chart that shows what percentage of households make at least a certain amount.


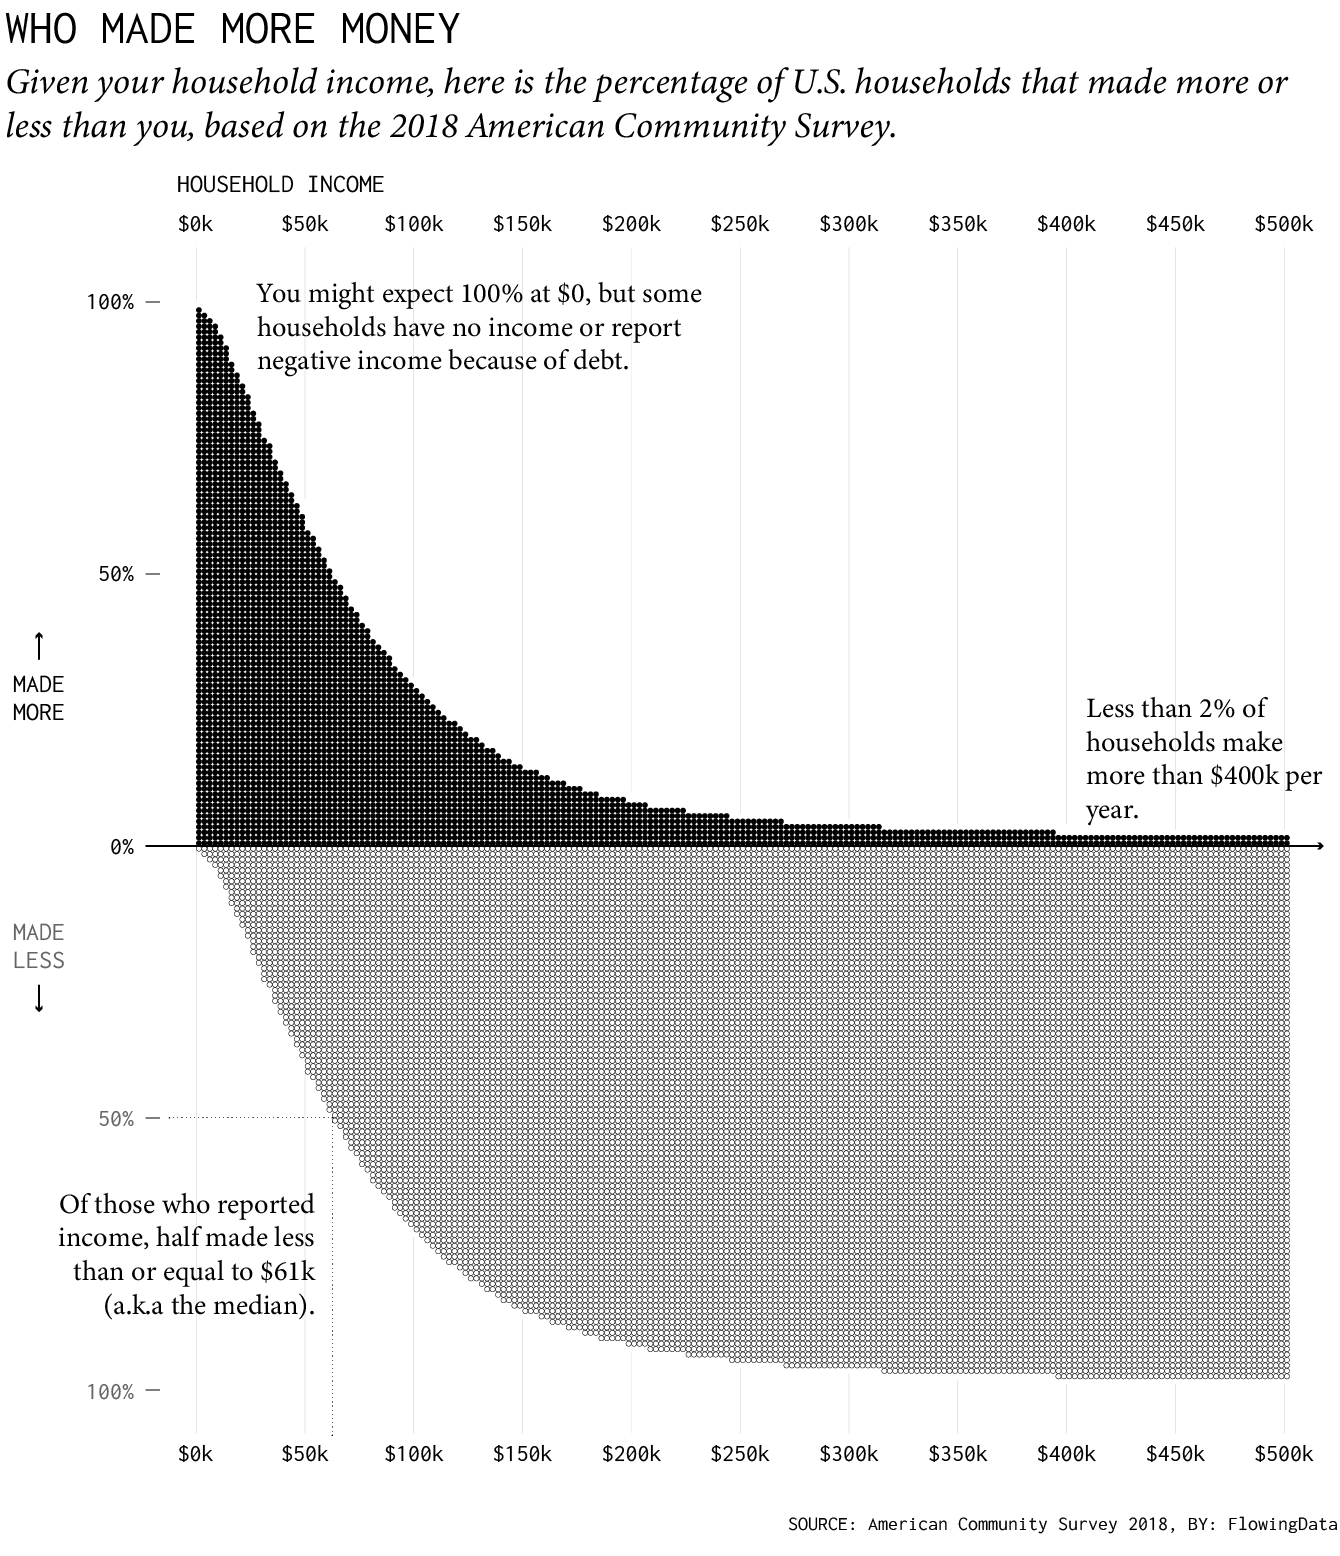
Less than two percent of households made at least $400,000 in 2018. So… not very common. I’m not sure what that person was thinking.

Become a member. Support an independent site. Make great charts.

See What You Get

Favorites

Reviving the Statistical Atlas of the United States with New Data

Due to budget cuts, there is no plan for an updated atlas. So I recreated the original 1870 Atlas using today’s publicly available data.

Cuisine Ingredients

What are the ingredients that make each cuisine? I looked at 40,000 recipes spanning 20 cuisines and 6,714 ingredients to see what makes food taste different.

Life expectancy changes

The data goes back to 1960 and up to the most current estimates for 2009. Each line represents a country.

Think Like a Statistician – Without the Math

I call myself a statistician, because, well, I’m a statistics graduate student. However, the most important things I’ve learned are less formal, but have proven extremely useful when working/playing with data.