Bachelor’s Degree Movers
As industries change and interests shift, some bachelor’s degrees grow more popular while others become less so. We already saw how the rankings changed over the decades. Now here’s the degrees that have changed the most since 1995.
Biggest Shifts for Bachelor’s Degrees
Comparing 1995 to 2017

+150%
Parks, recreation, leisure, and fitness studies
+100%
These degrees became more popular.
Computer and information sciences
Health professions and related programs
+50%
Homeland security, law enforcement, and firefighting
Legal professions and studies
Communication, journalism, and related programs
Biological and biomedical sciences
Mathematics and statistics
Engineering
Visual and performing arts
0%
Area, ethnic, cultural, gender, and group studies
Transportation and materials moving
Philosophy and religious studies
Liberal arts and sciences and humanities
Social sciences and history
These degrees became less popular.
Foreign languages, literatures, and linguistics
Engineering technologies
Architecture and related services
−50%
English language and literature/letters
Education
1995
2000
2005
2010
2015

+150%
Parks, recreation, leisure,
and fitness studies
+100%
Computer and info. sciences
Health professions
+50%
Law enforcement, firefighting
Legal professions
Communication, journalism
Biological and biomedical
Mathematics and statistics
Engineering
Visual and performing arts
0%
Ethnic, cultural studies
Transportation, materials
Philosophy and religion
Liberal arts and sciences
Social sciences and history
Foreign languages, lit.
Engineering technologies
Architecture
−50%
English language and lit.
Education
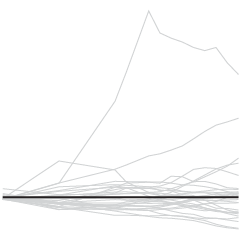
The data comes from the National Center for Education Statistics. Again, these are the degrees that showed the most change rather than degrees that were most popular. See the rankings chart for the latter. For each time segment, I calculated percentage and compared it against the percentage for 1995.
Parks and rec is killing it, more than doubling since 1995. Education and English not so much, each with a decline of about half, which I have a feeling has a lot do with more options.
Chart Type Used
Become a member. Support an independent site. Get extra visualization goodness.
See What You Get